
This is the work-in-progress
Yield Report,
generated Friday July 24, 2026 3:08PM (PDT)
and regenerated daily at the close of US trading
(and delivered free to subscribers)
Nothing in this report constitues financial advice.
No guarantees are made for the reliability or correctness of data presented.
Yields · Inflation · Employment · Money · Lending · Federal · Macro
Yields
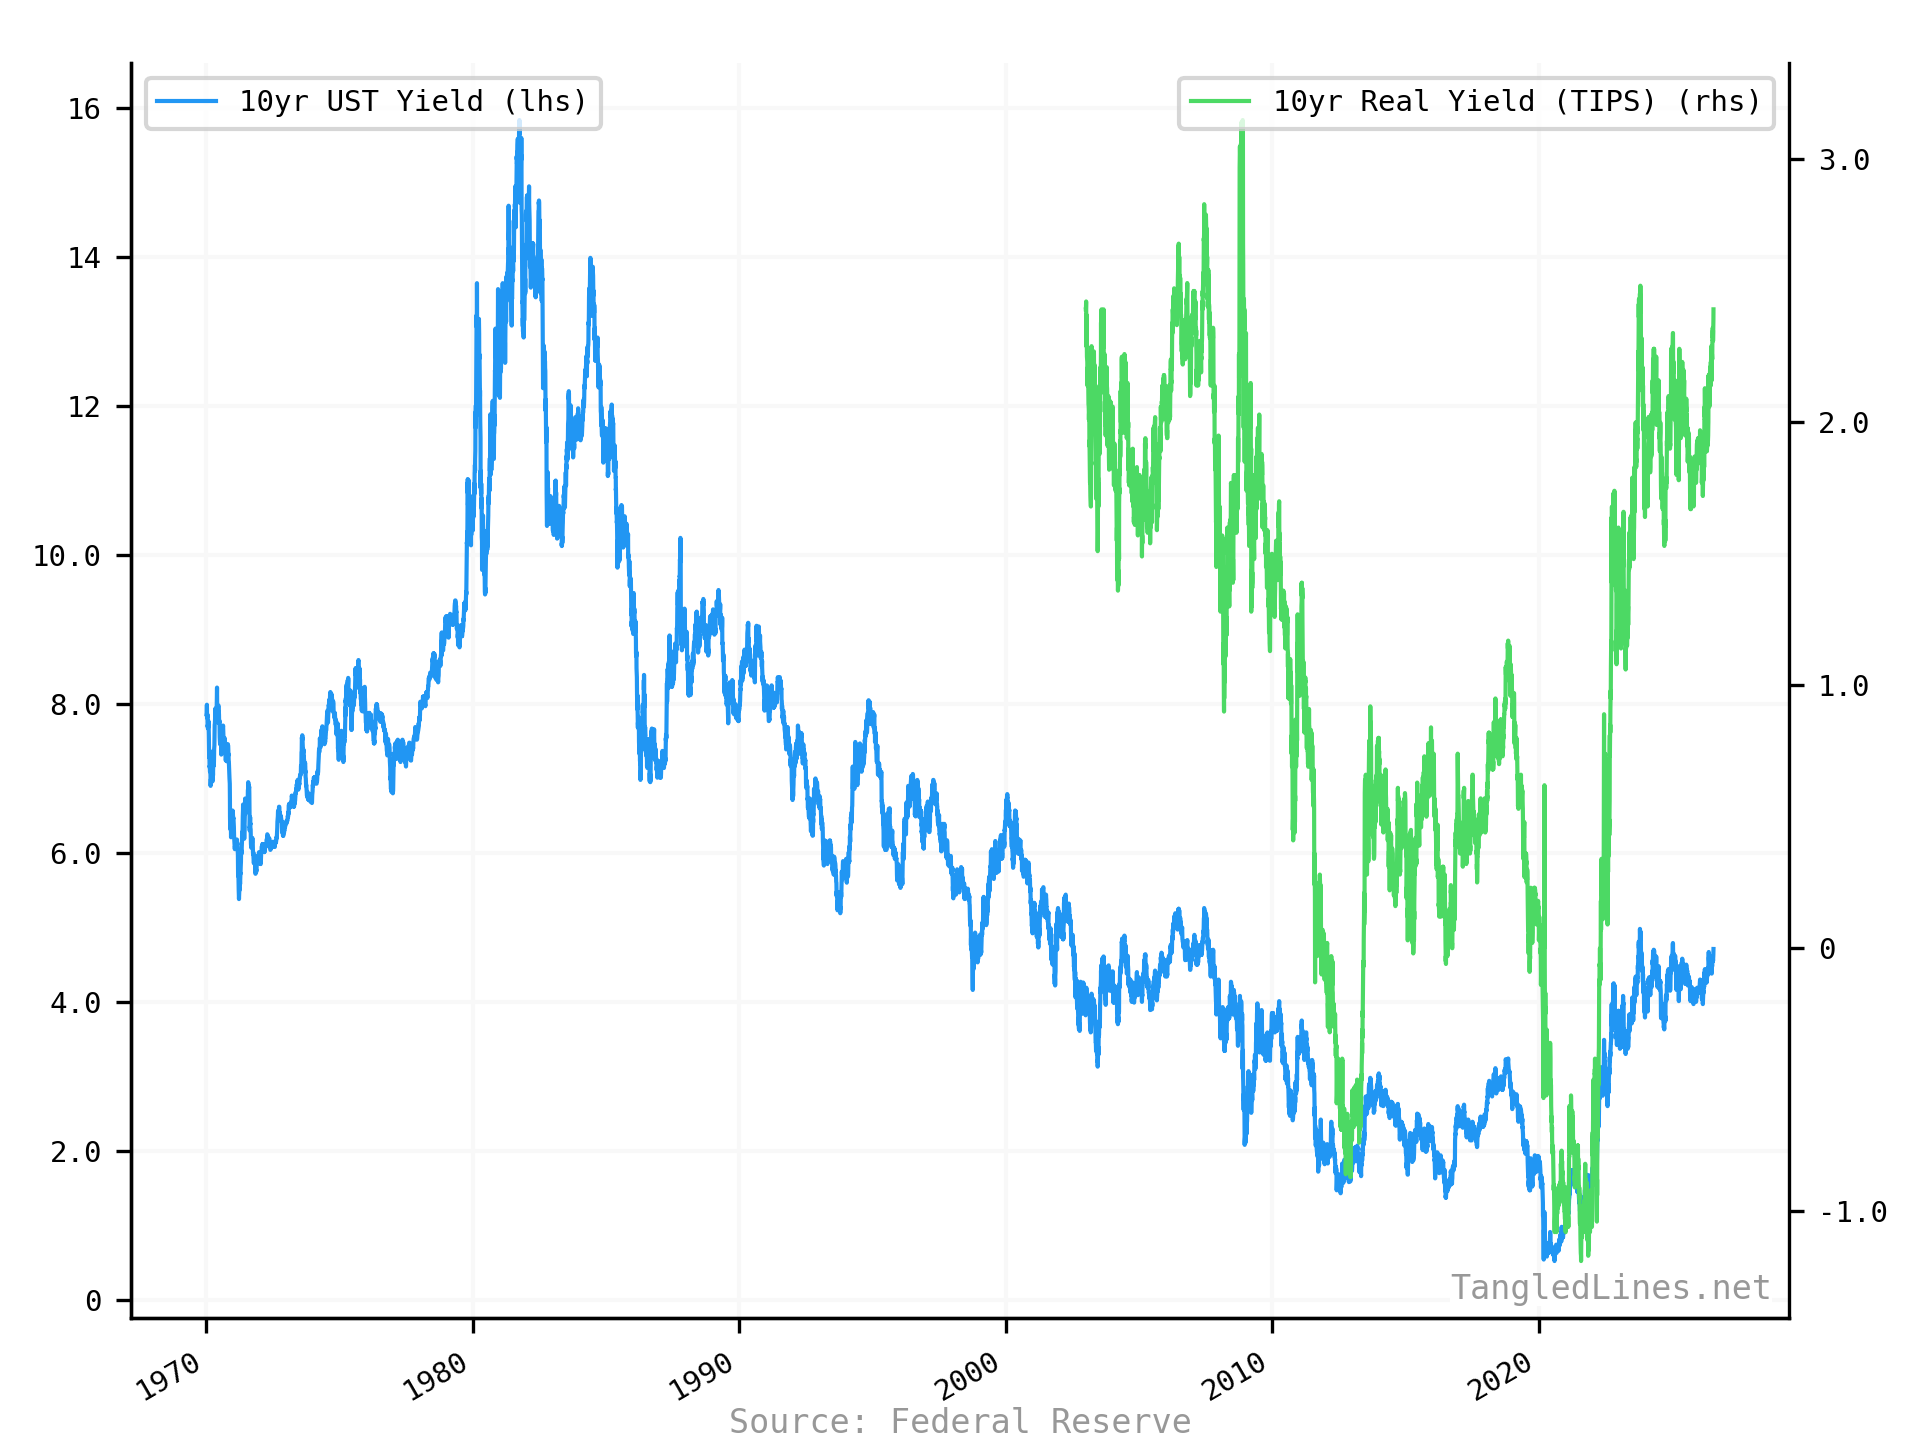
10yr UST Yield

| Series | Latest | Date |
|---|---|---|
| 10yr UST Yield | 4.71 | 2026-07-23
Reported 2026-07-24 |
| 10yr Real Yield (TIPS) | 2.43 | 2026-07-23
Reported 2026-07-24 |
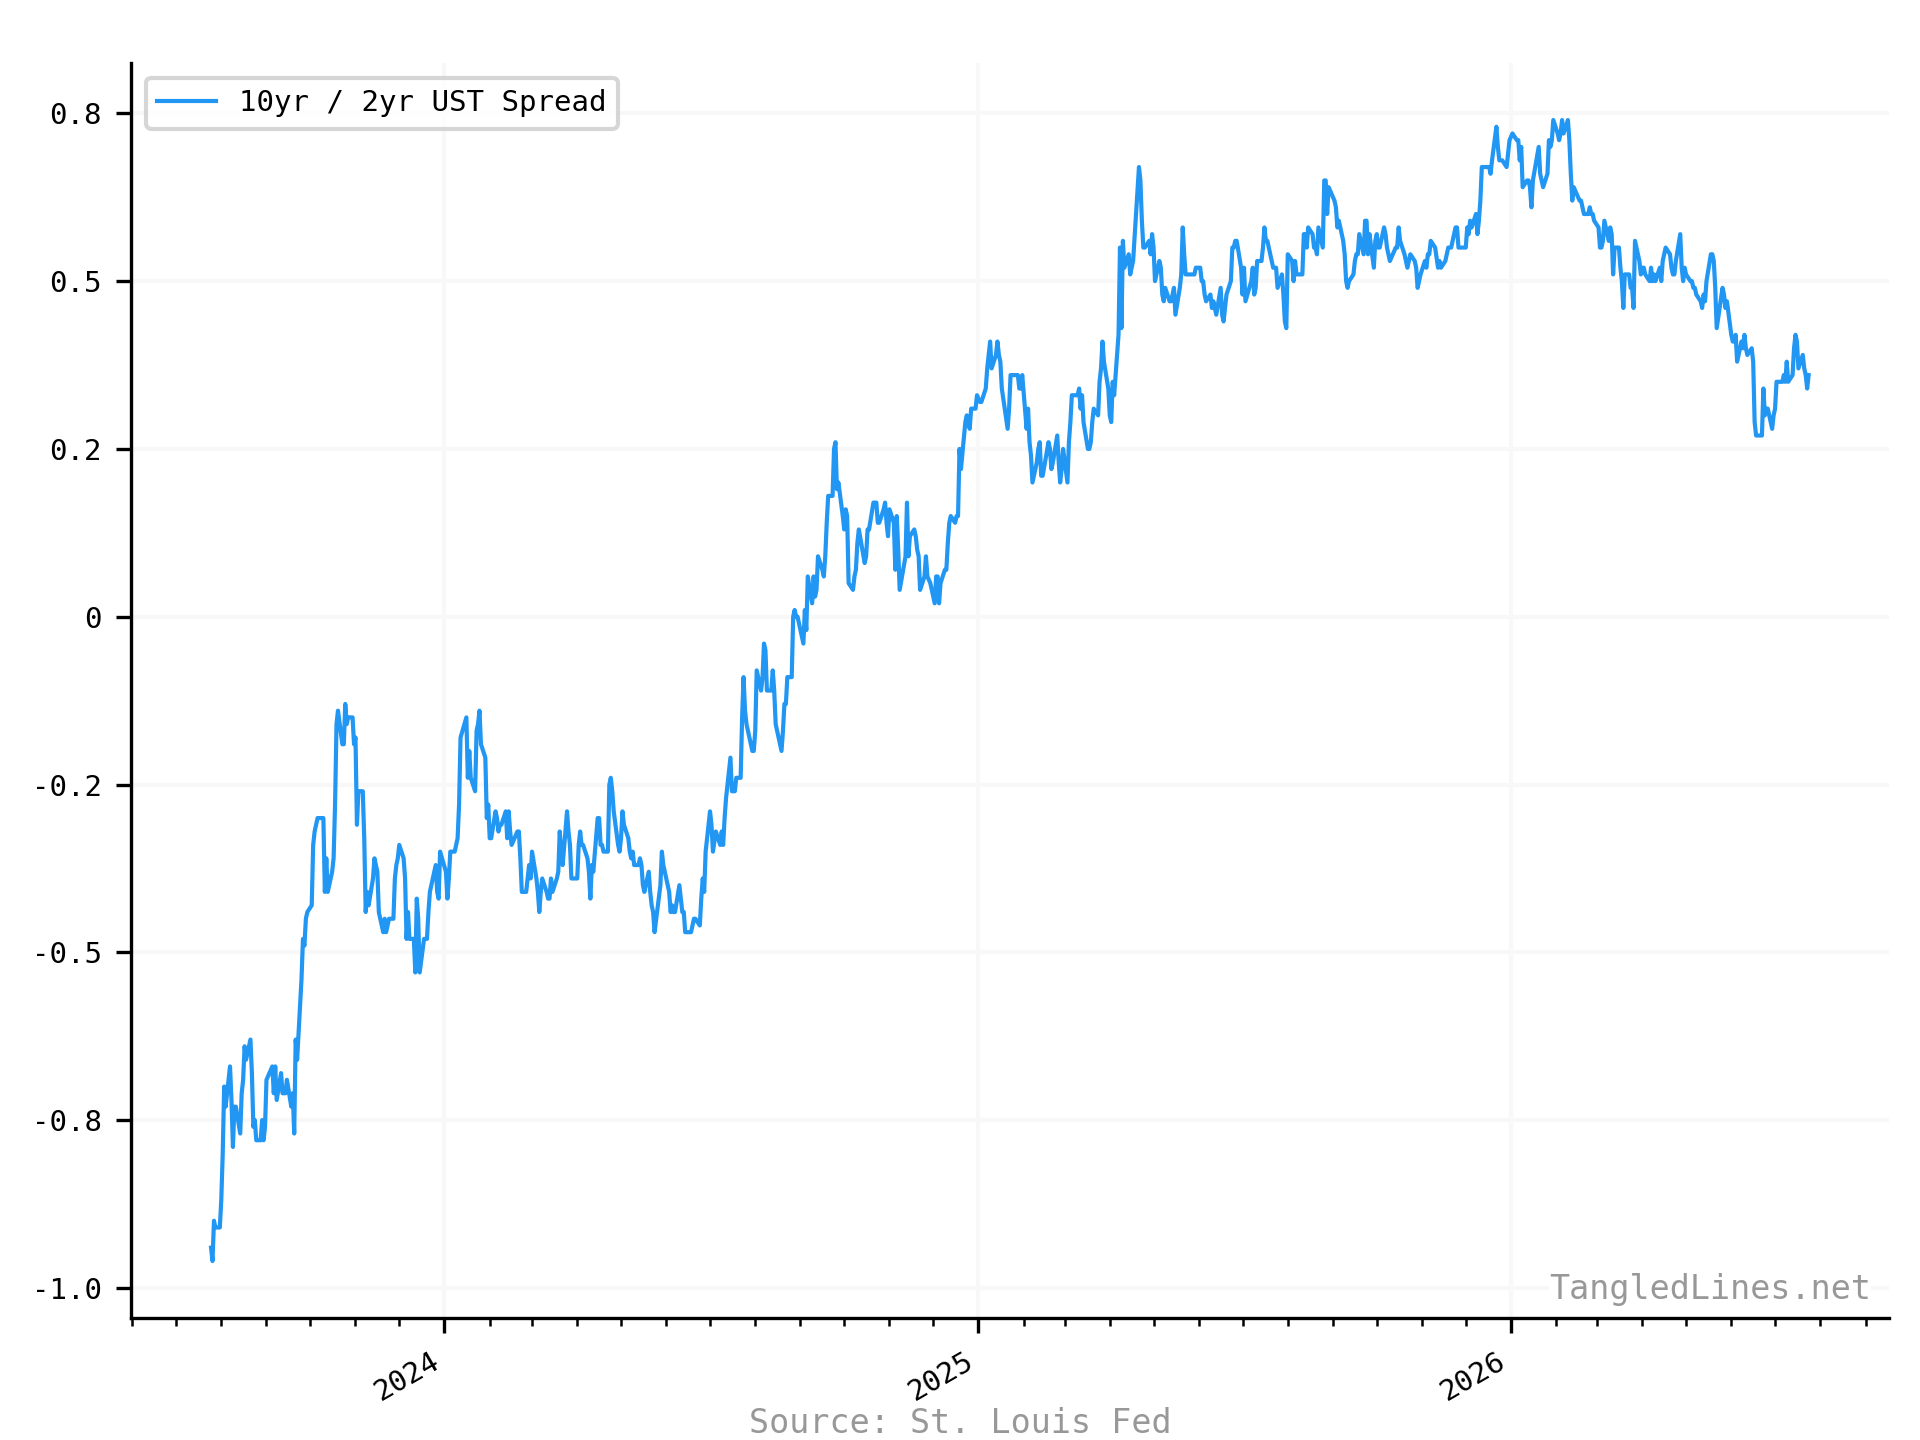
10yr / 2yr UST Spread

| Series | Latest | Date |
|---|---|---|
| 10yr / 2yr UST Spread | 0.36 | 2026-07-24
Reported 2026-07-24 |
Historical Spreads
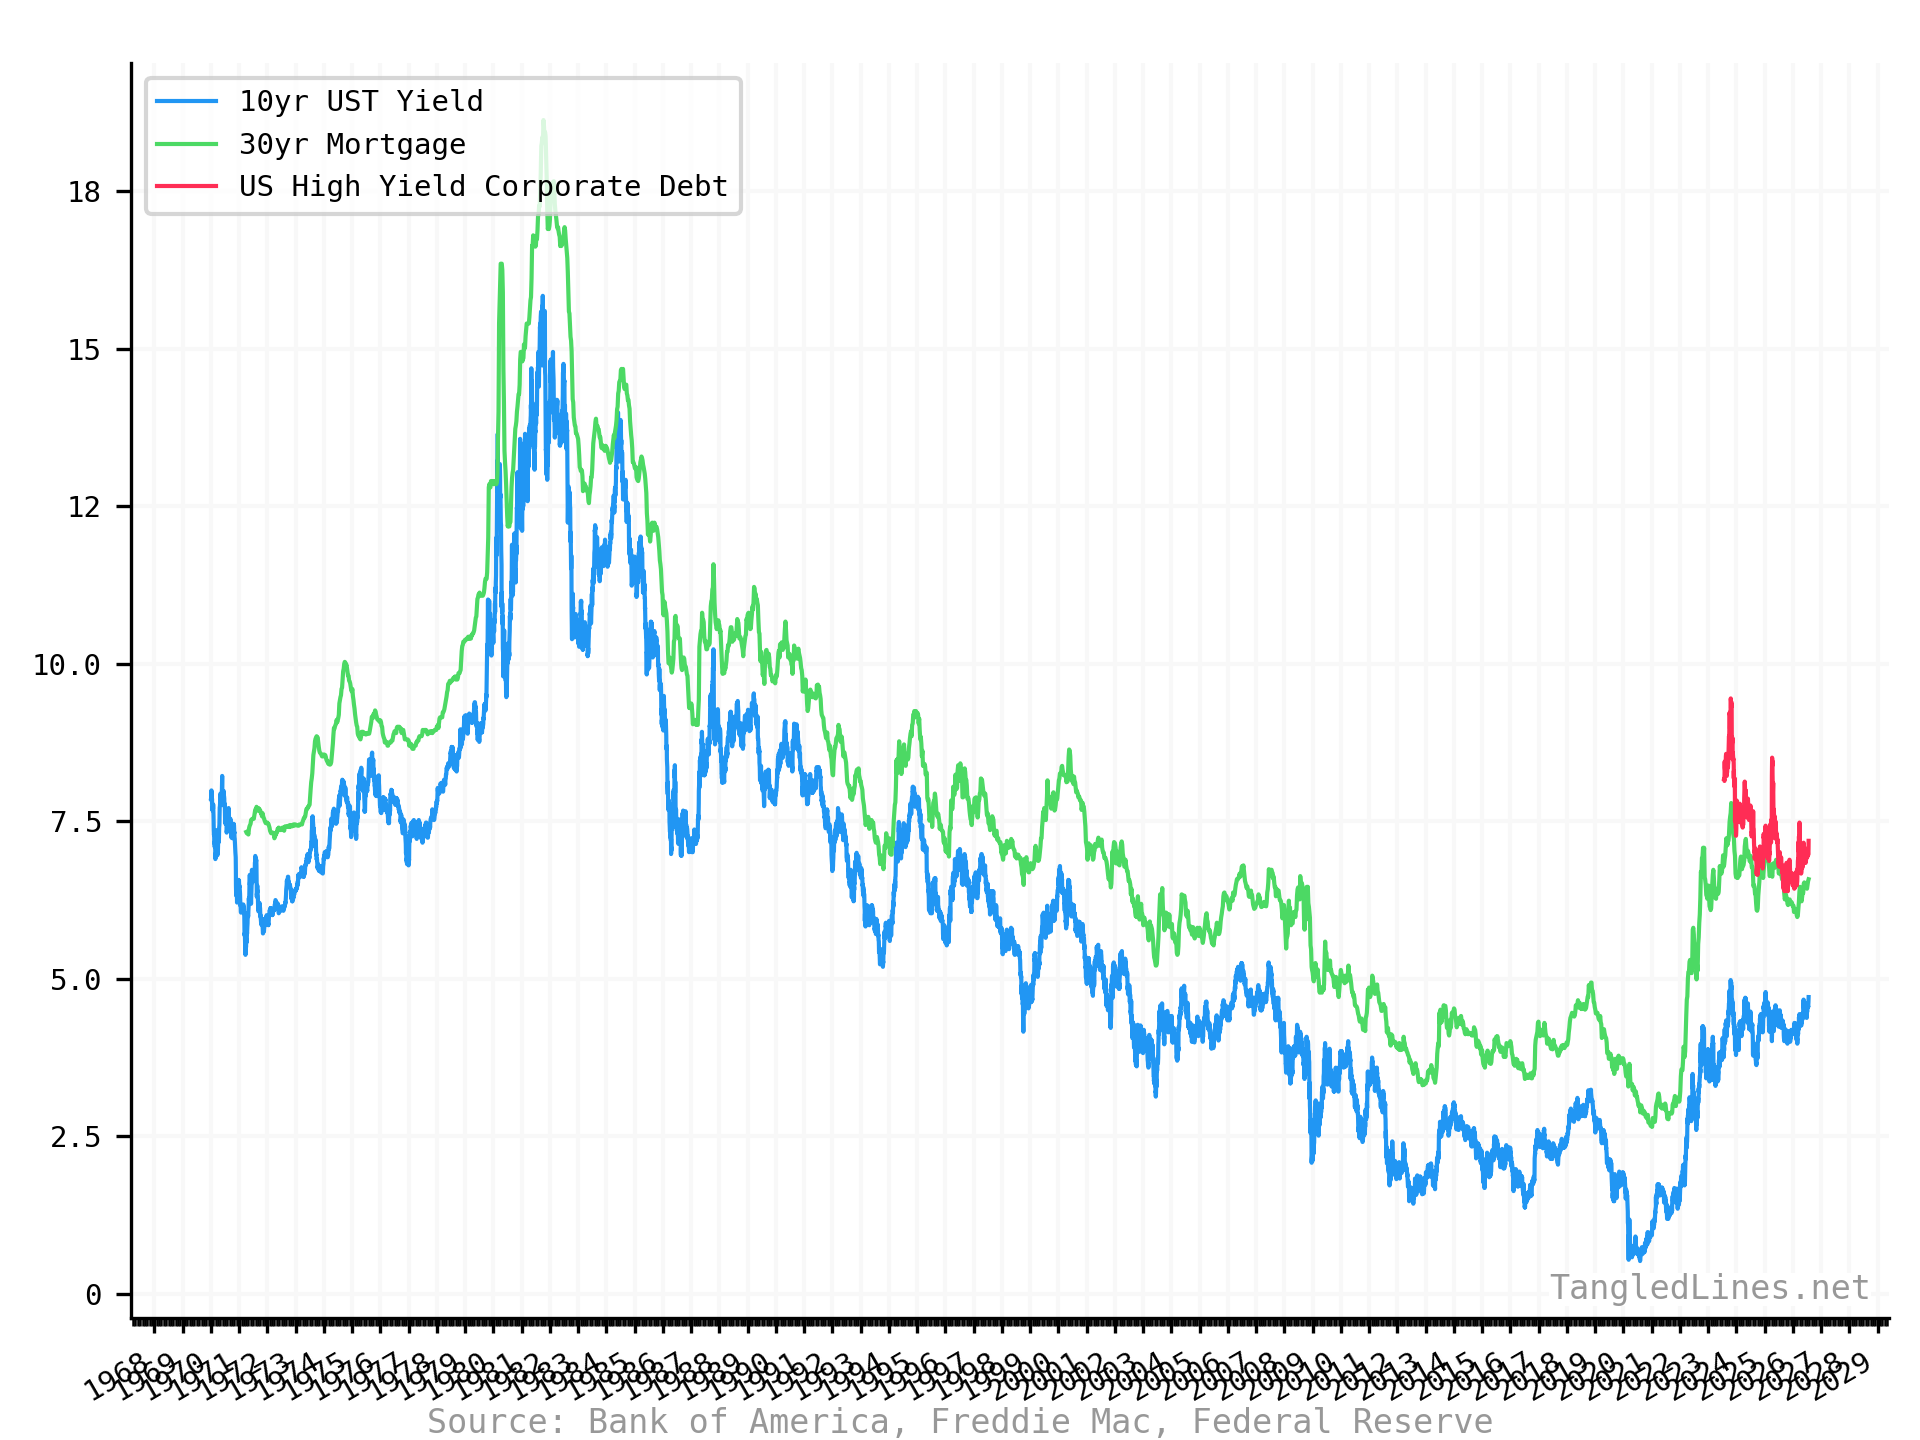
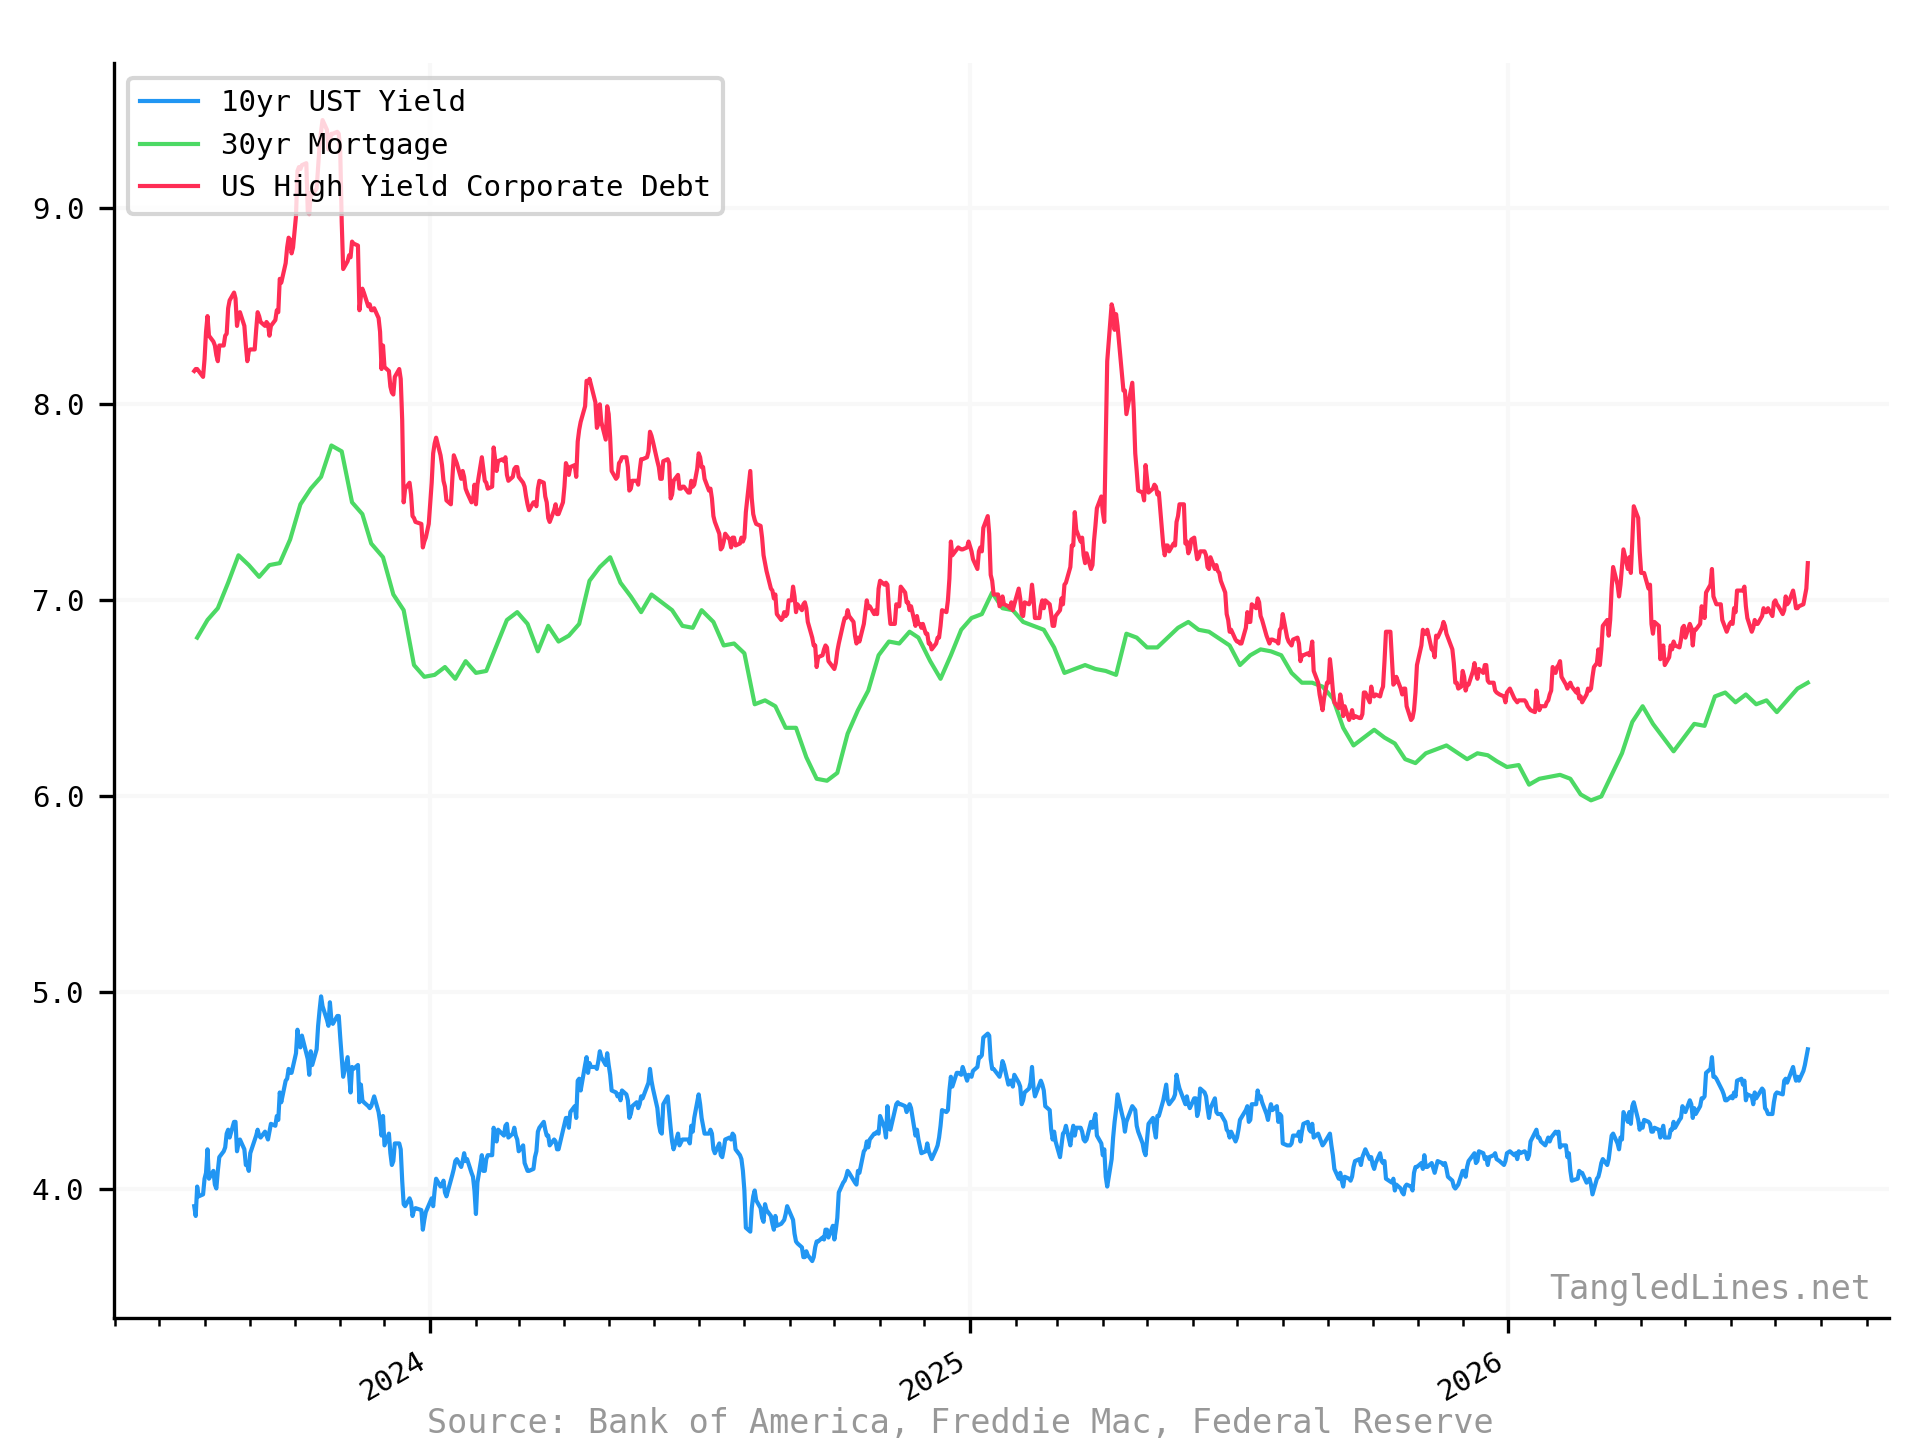
| Series | Latest | Date |
|---|---|---|
| 10yr UST Yield | 4.71 | 2026-07-23
Reported 2026-07-24 |
| 30yr Mortgage | 6.58 | 2026-07-23
Reported 2026-07-23 |
| US High Yield Corporate Debt | 7.19 | 2026-07-23
Reported 2026-07-24 |
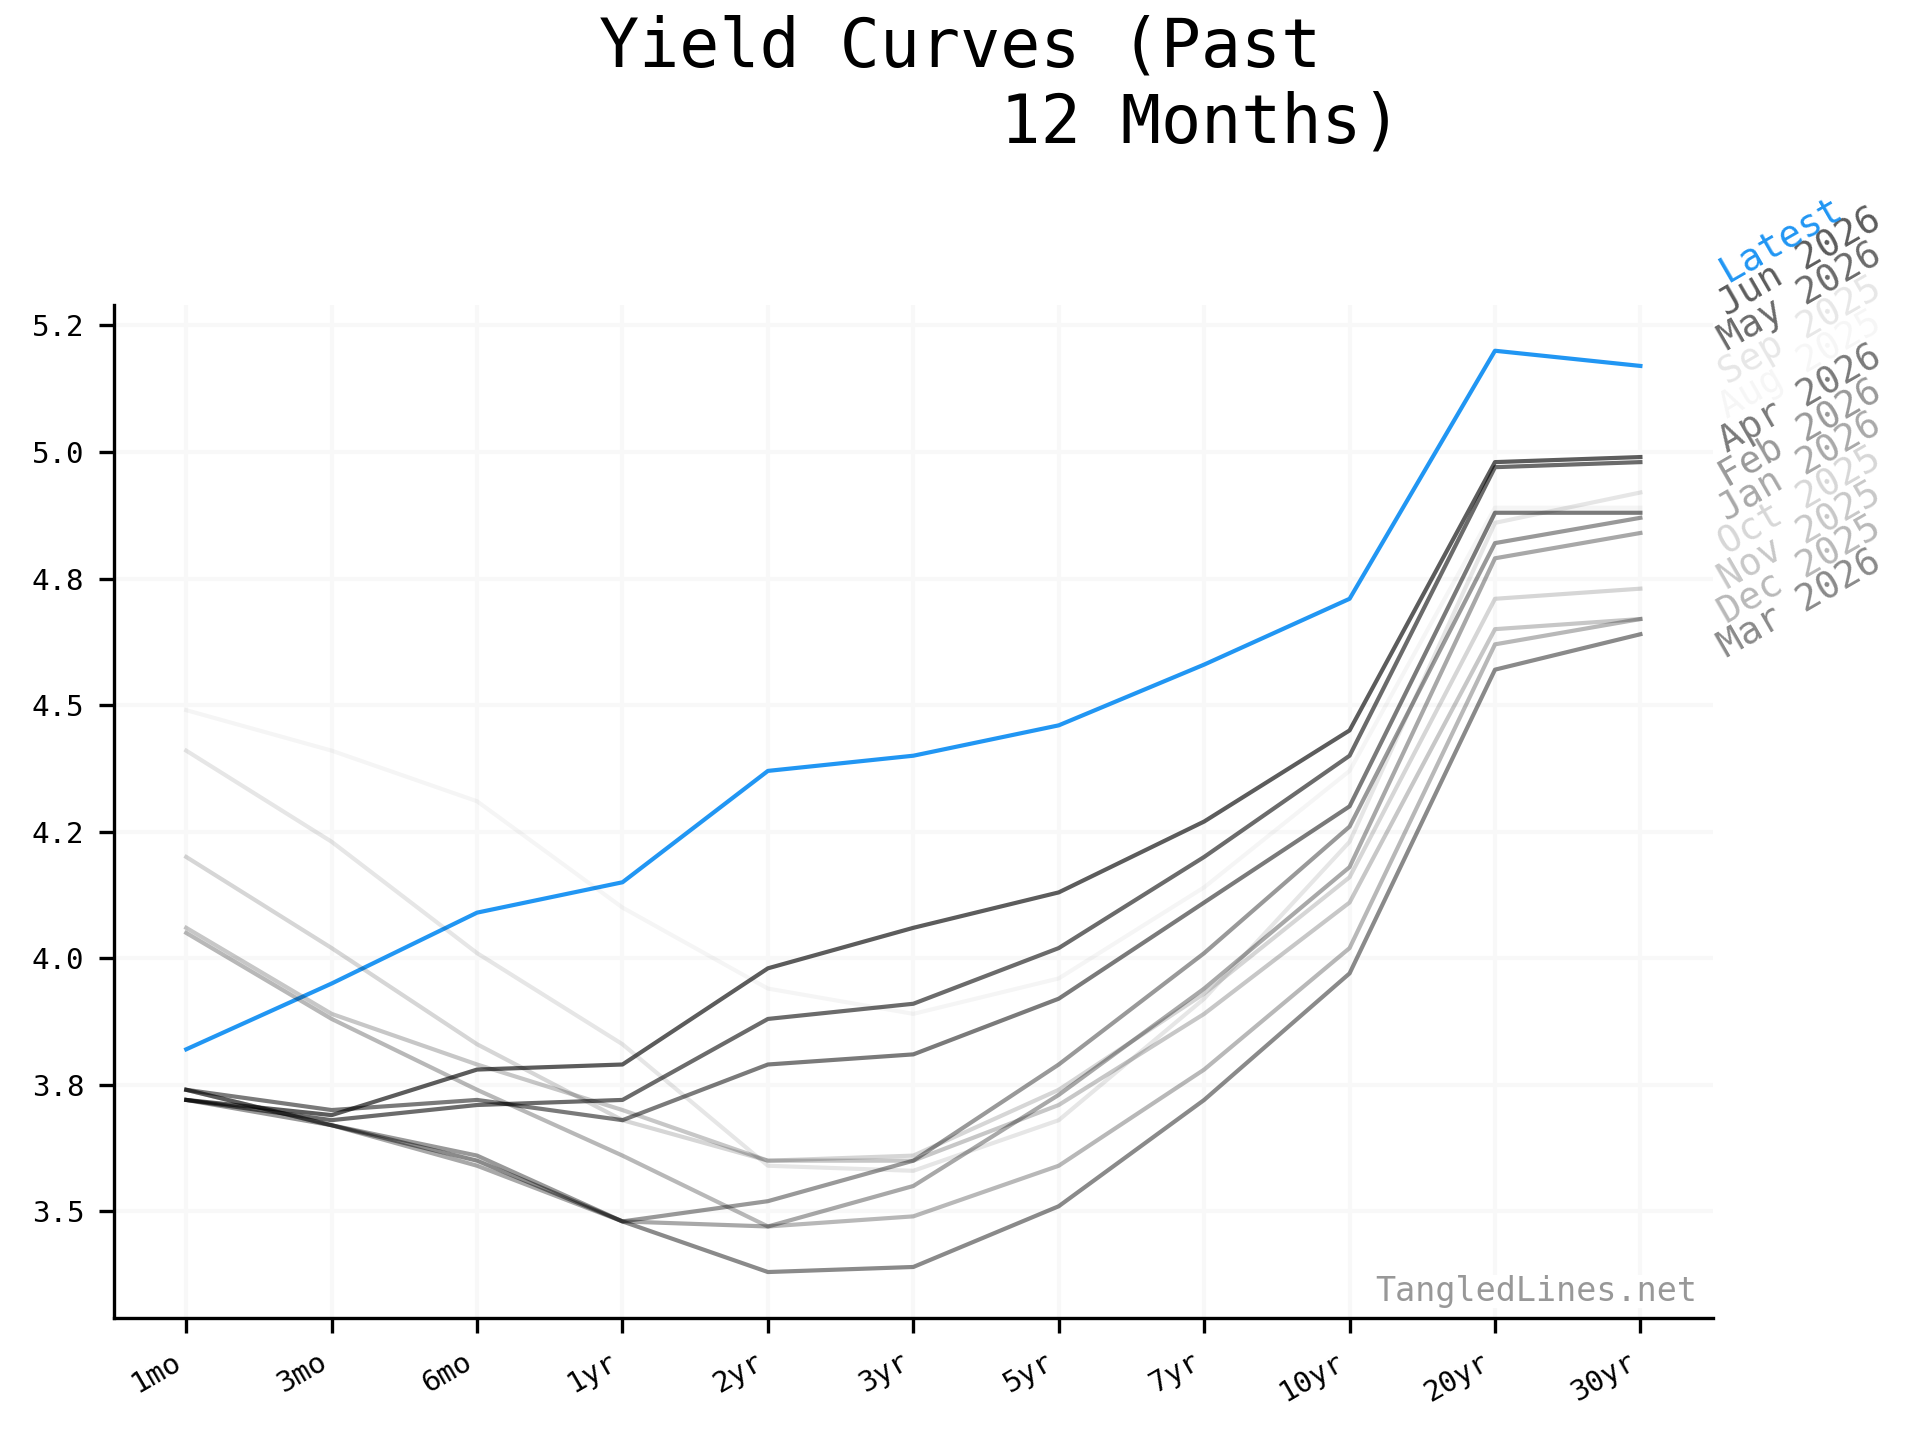
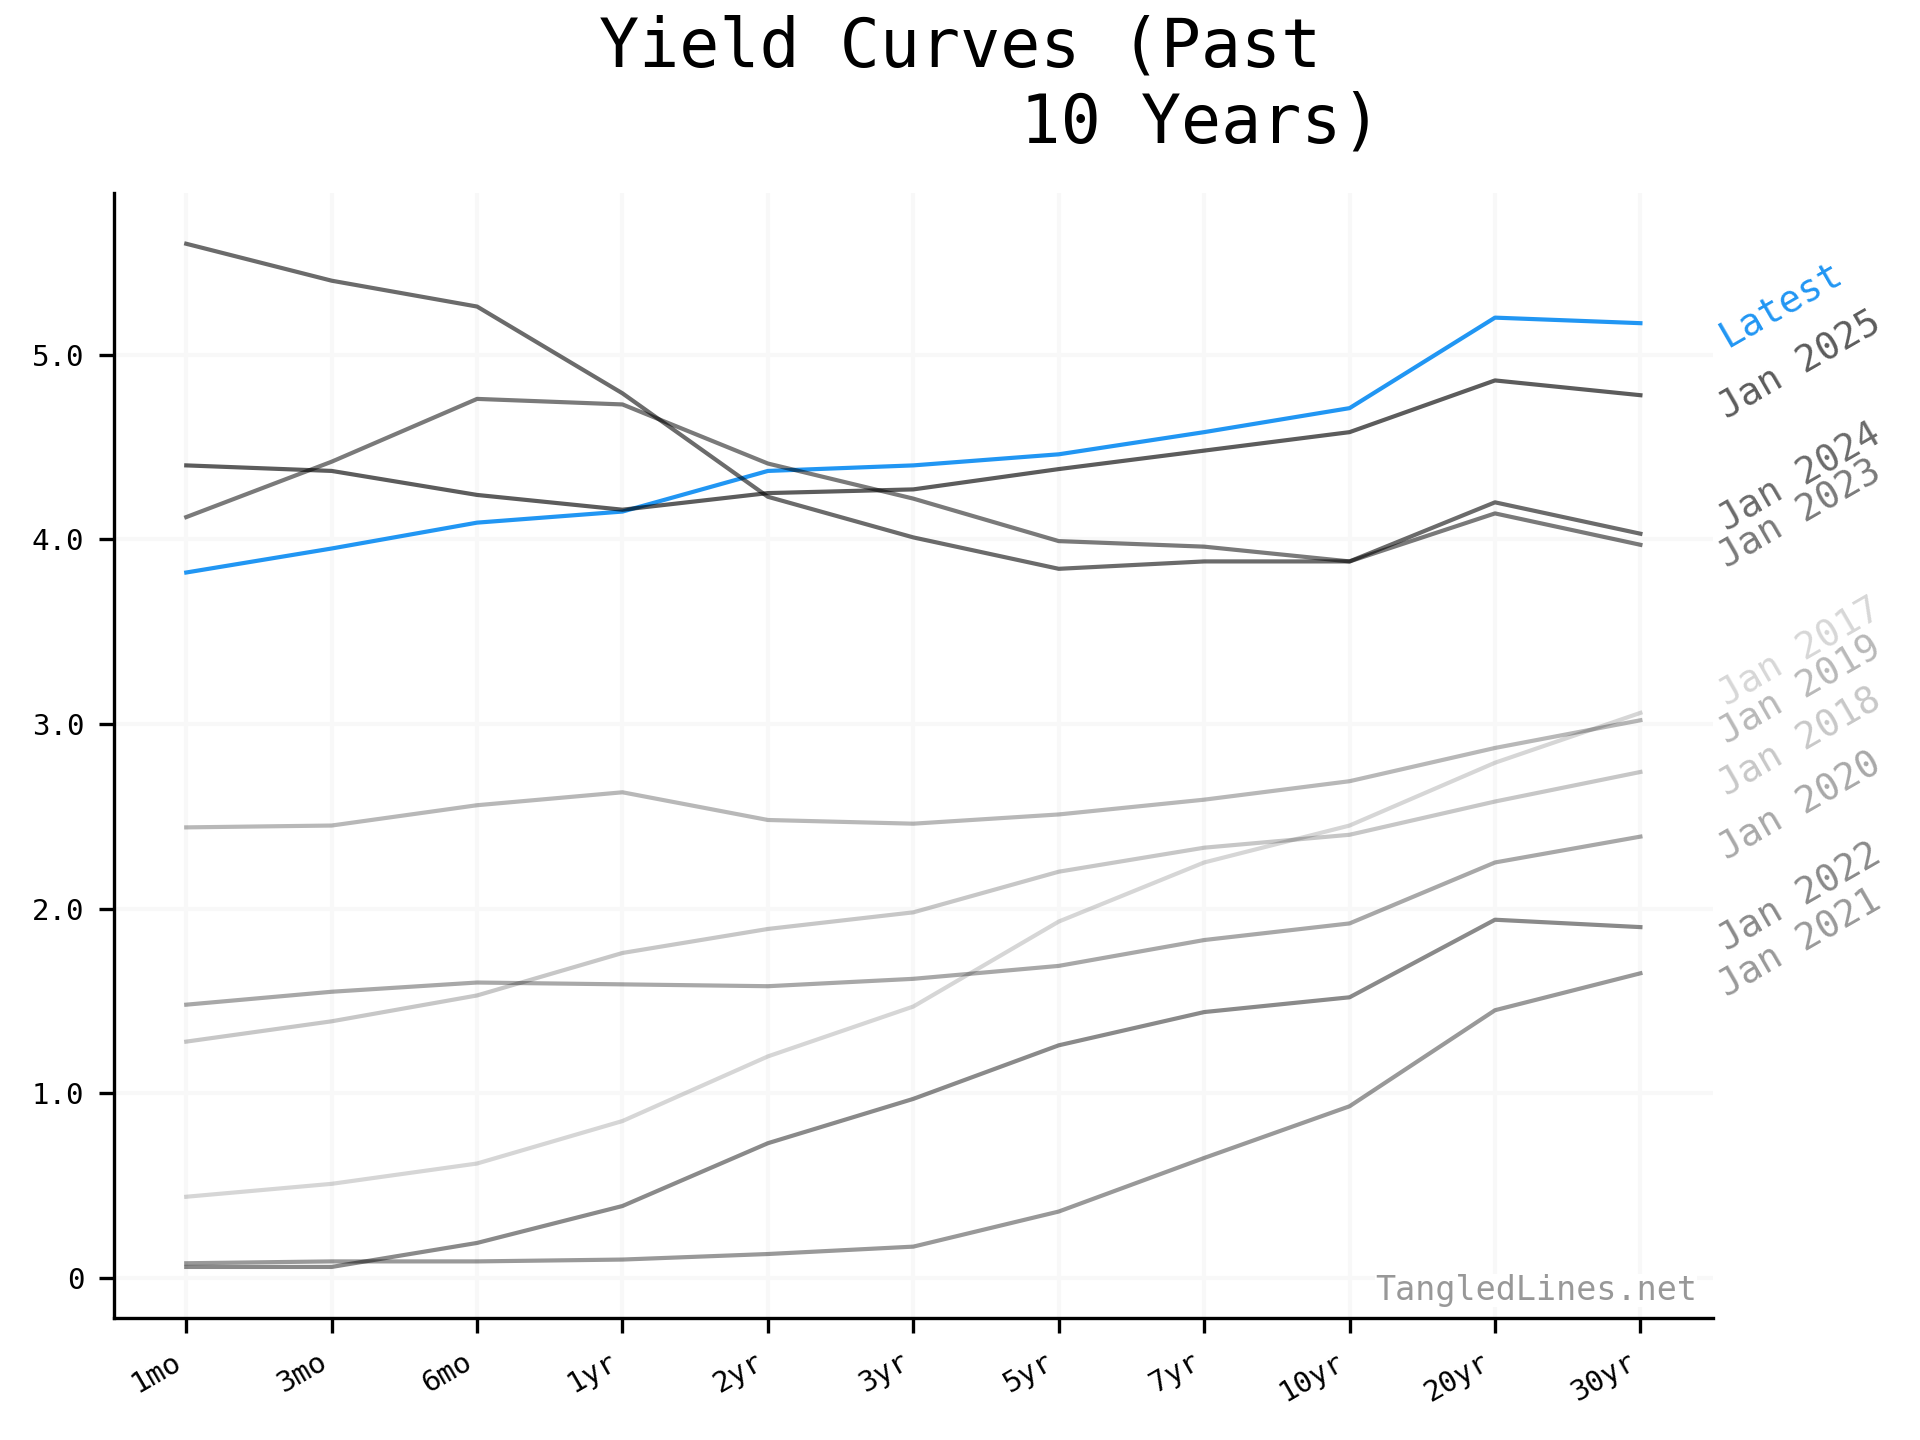
Historical USTs
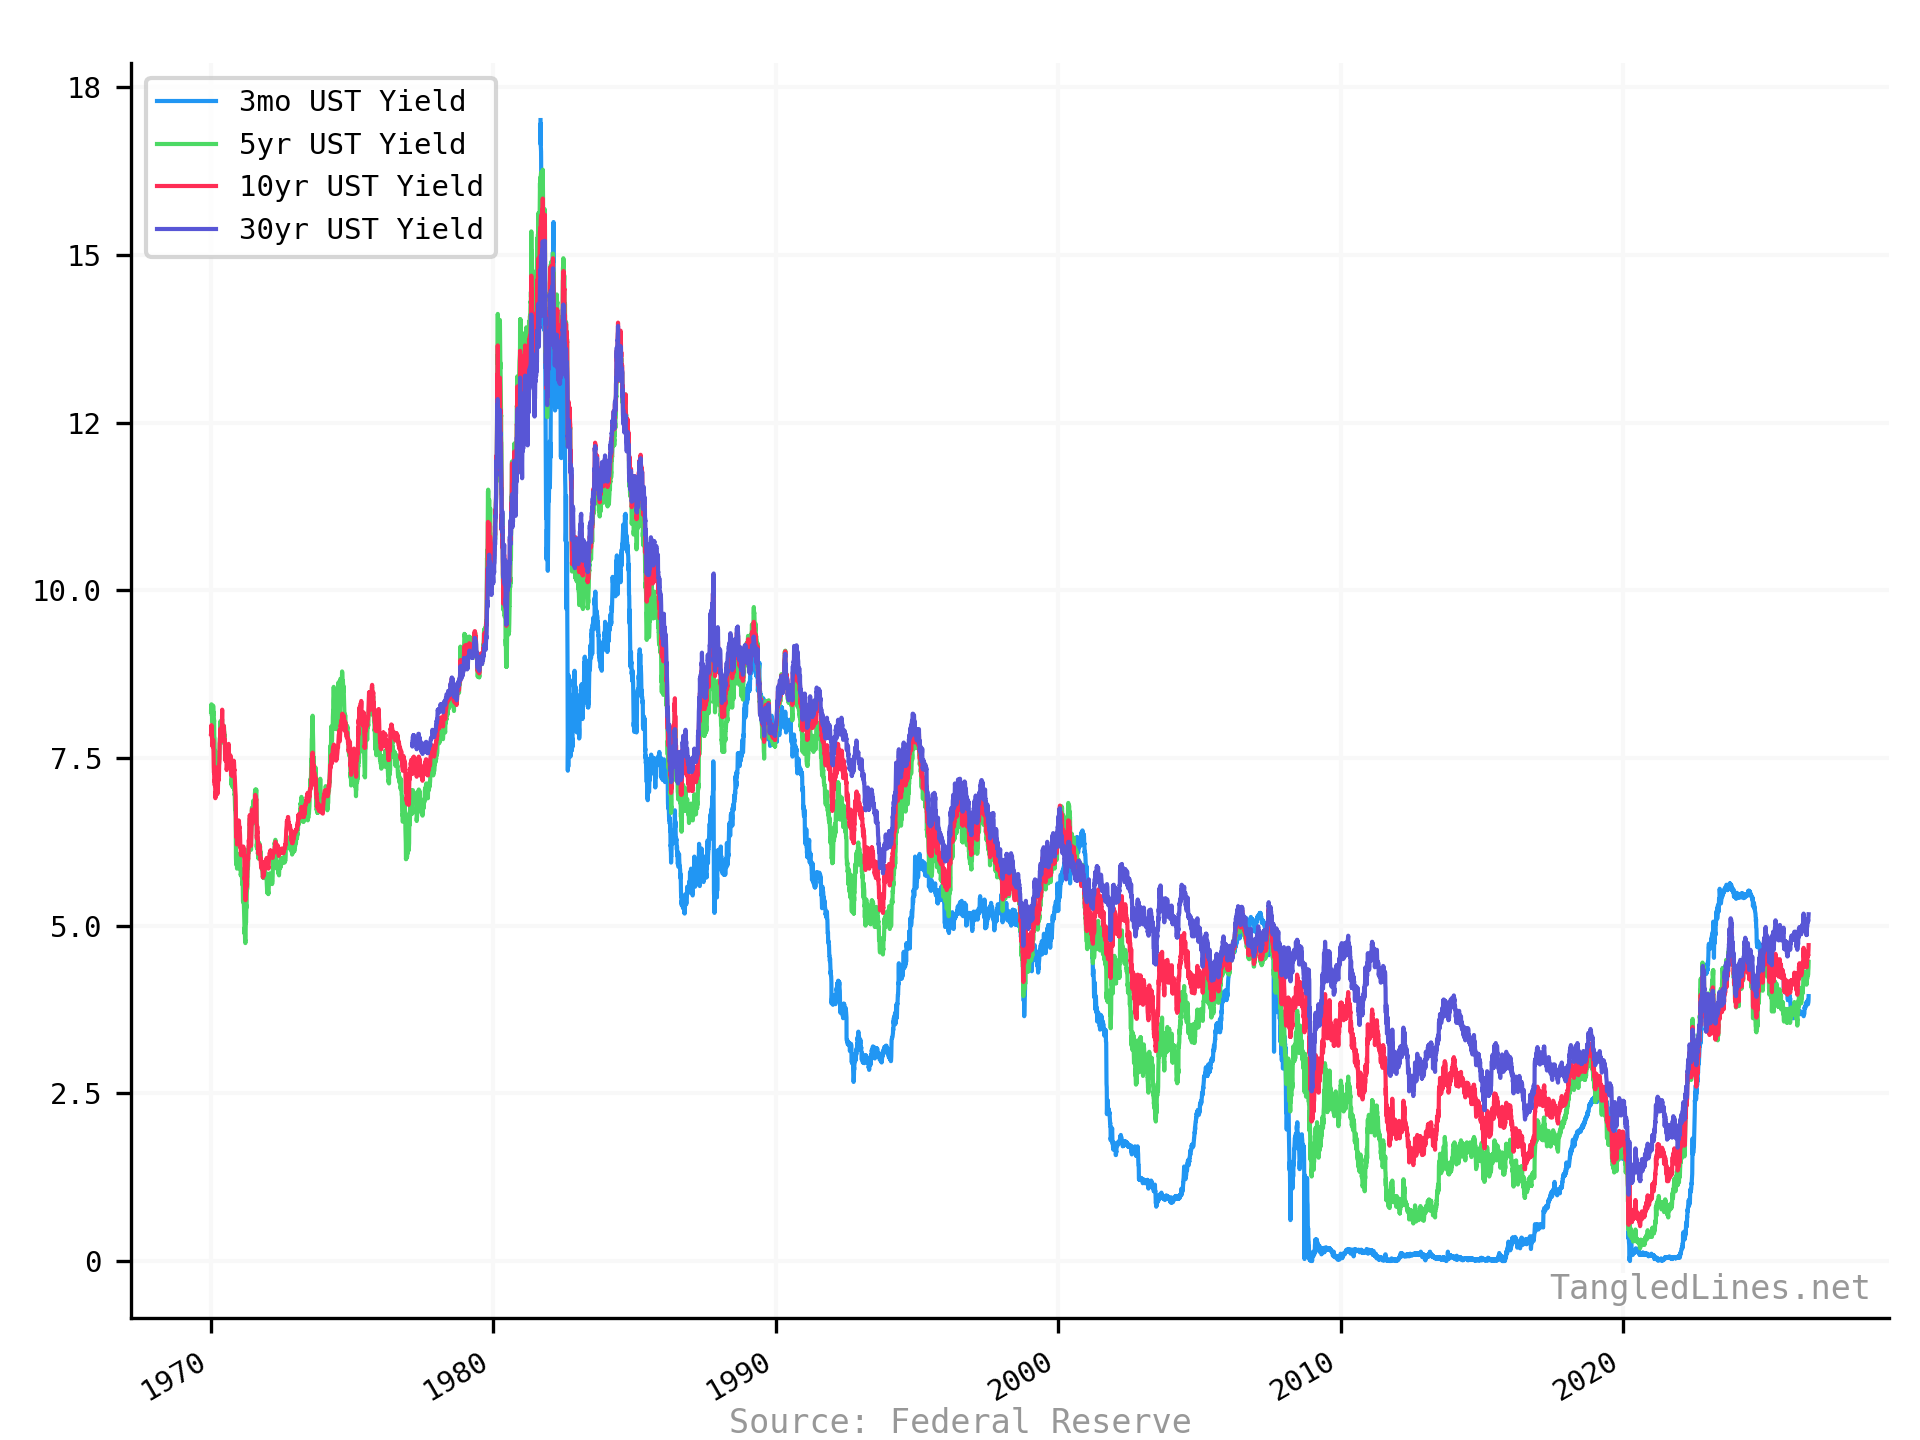
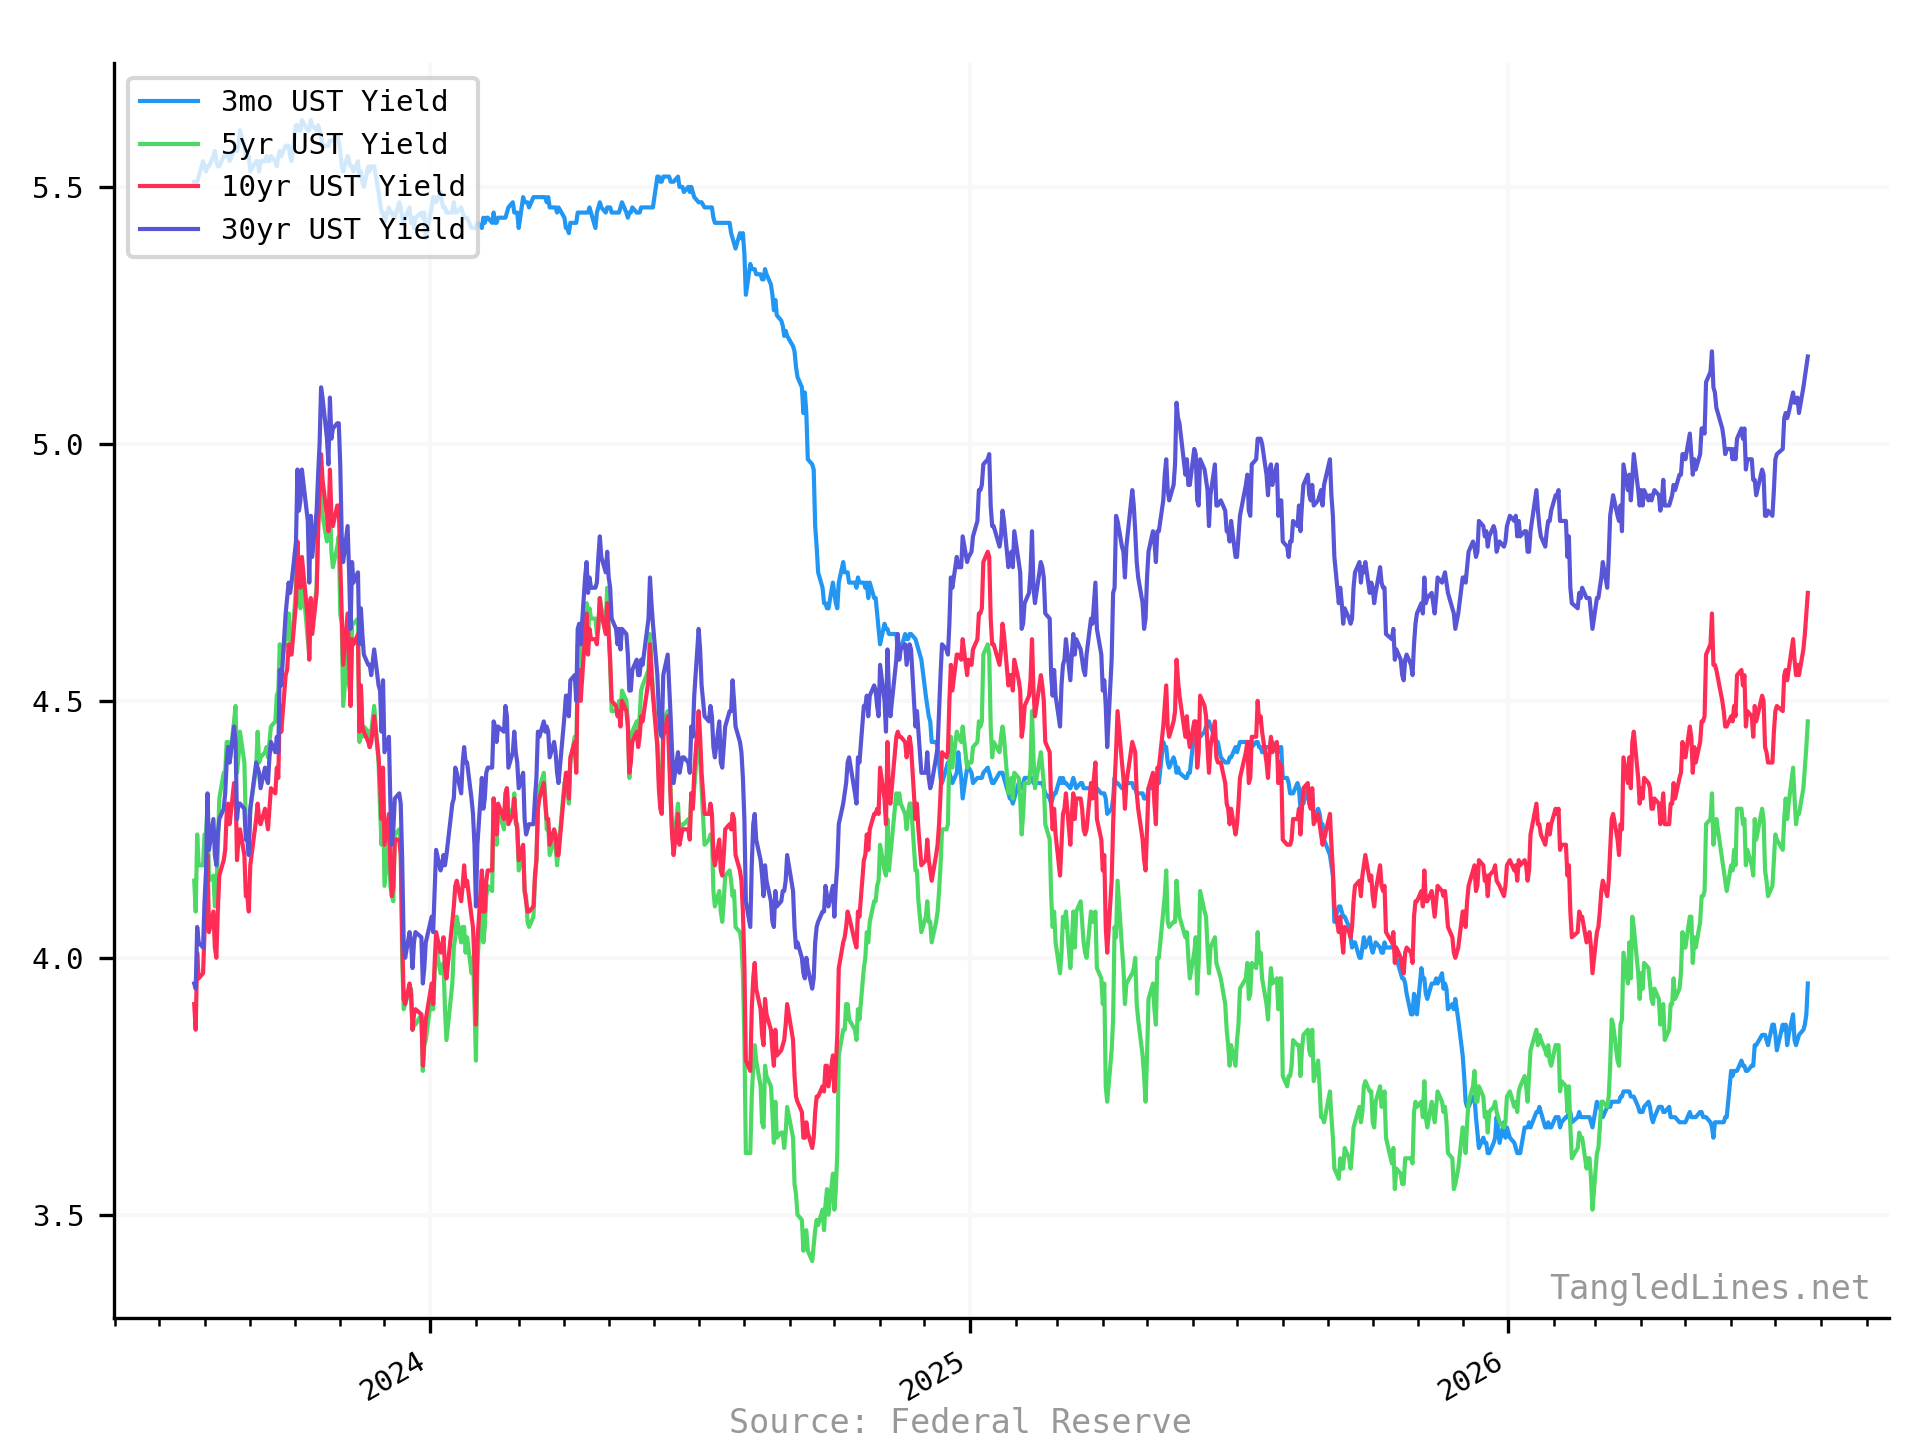
| Series | Latest | Date |
|---|---|---|
| 3mo UST Yield | 3.95 | 2026-07-23
Reported 2026-07-24 |
| 5yr UST Yield | 4.46 | 2026-07-23
Reported 2026-07-24 |
| 10yr UST Yield | 4.71 | 2026-07-23
Reported 2026-07-24 |
| 30yr UST Yield | 5.17 | 2026-07-23
Reported 2026-07-24 |
International 10yr Bond Yields


| Series | Latest | Date |
|---|---|---|
| US 10yr Yield | 4.47 | 2026-06-01
Reported 2026-07-16 |
| UK 10yr Yield | 4.80 | 2026-06-01
Reported 2026-07-16 |
| Japan 10yr Yield | 2.67 | 2026-06-01
Reported 2026-07-16 |
| Germany 10yr Yield | 2.97 | 2026-06-01
Reported 2026-07-16 |
| Italy 10yr Yield | 3.73 | 2026-06-01
Reported 2026-07-16 |
| Australia 10yr Yield | 4.83 | 2026-06-01
Reported 2026-07-16 |
Inflation
Inflation Breakevens
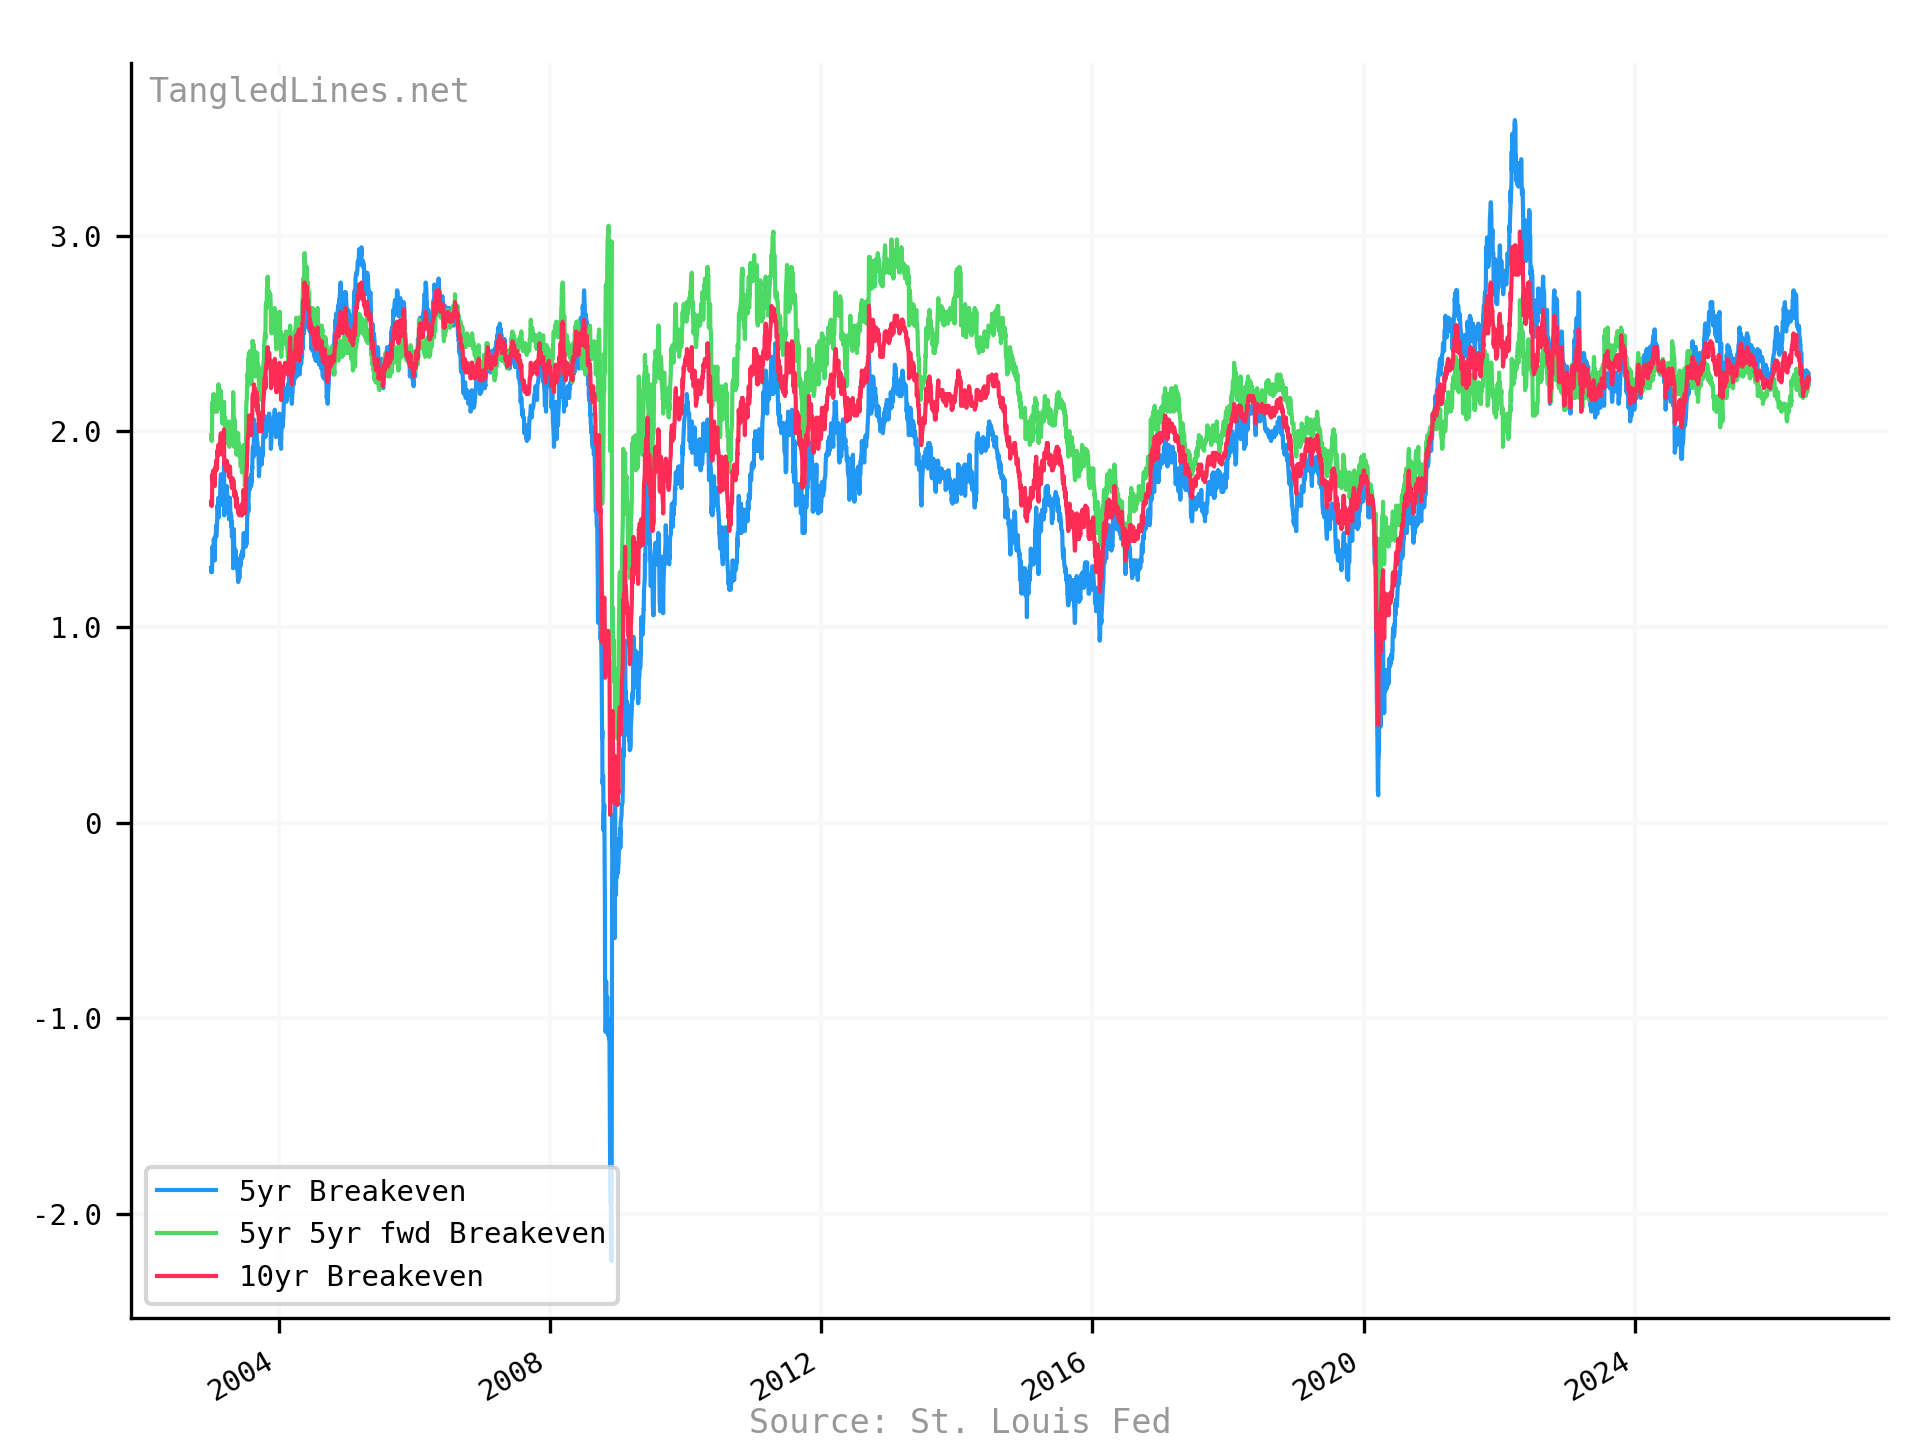

| Series | Latest | Date |
|---|---|---|
| 5yr Breakeven | 2.24 | 2026-07-24
Reported 2026-07-24 |
| 5yr 5yr fwd Breakeven | 2.28 | 2026-07-24
Reported 2026-07-24 |
| 10yr Breakeven | 2.26 | 2026-07-24
Reported 2026-07-24 |
CPI YoY
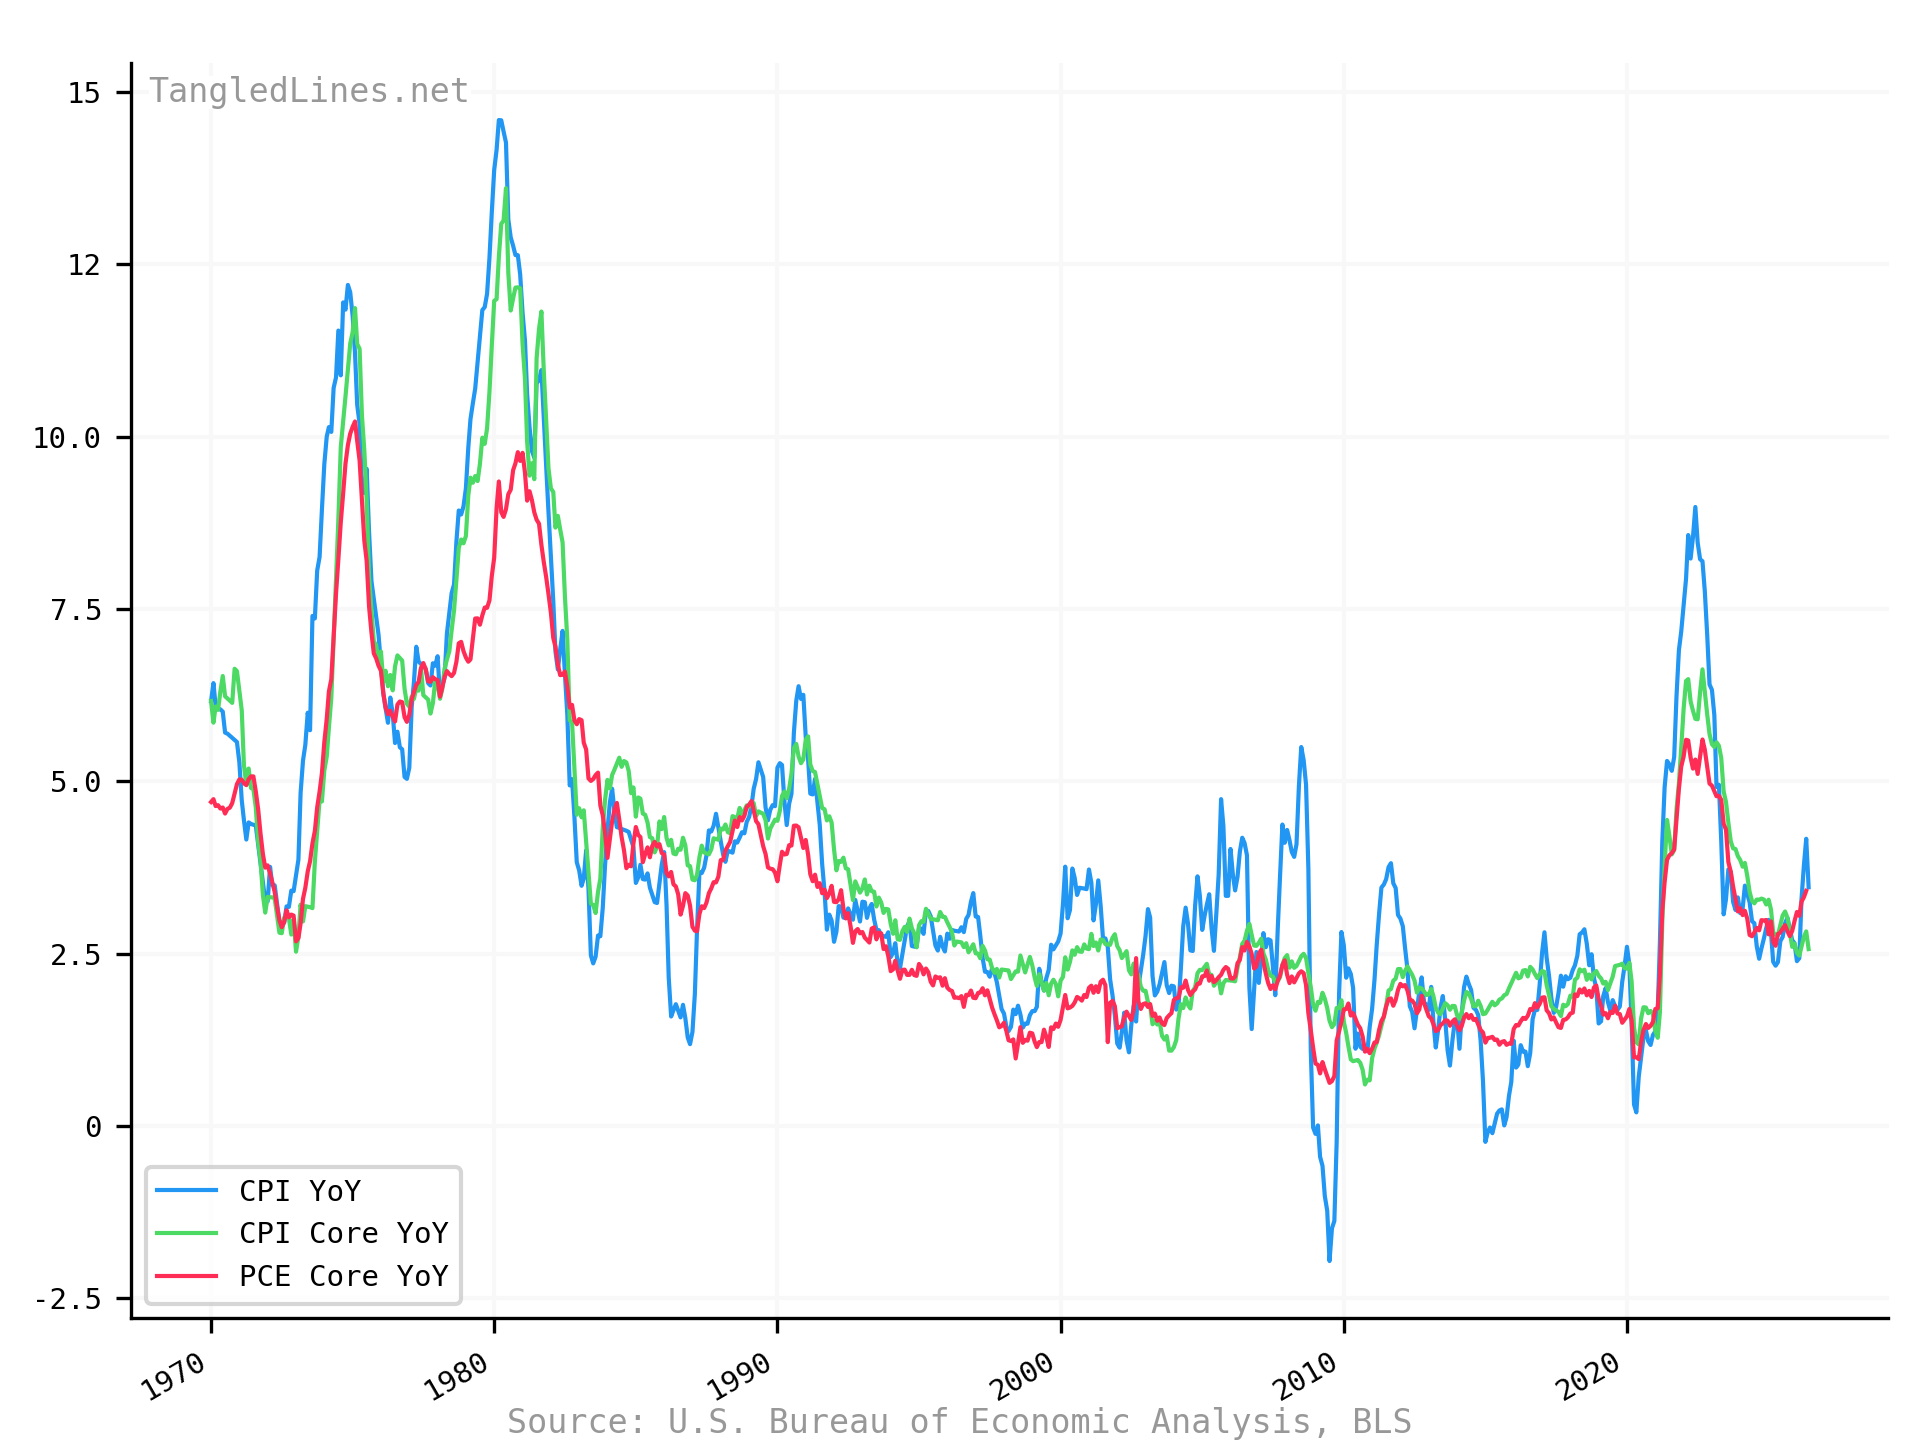
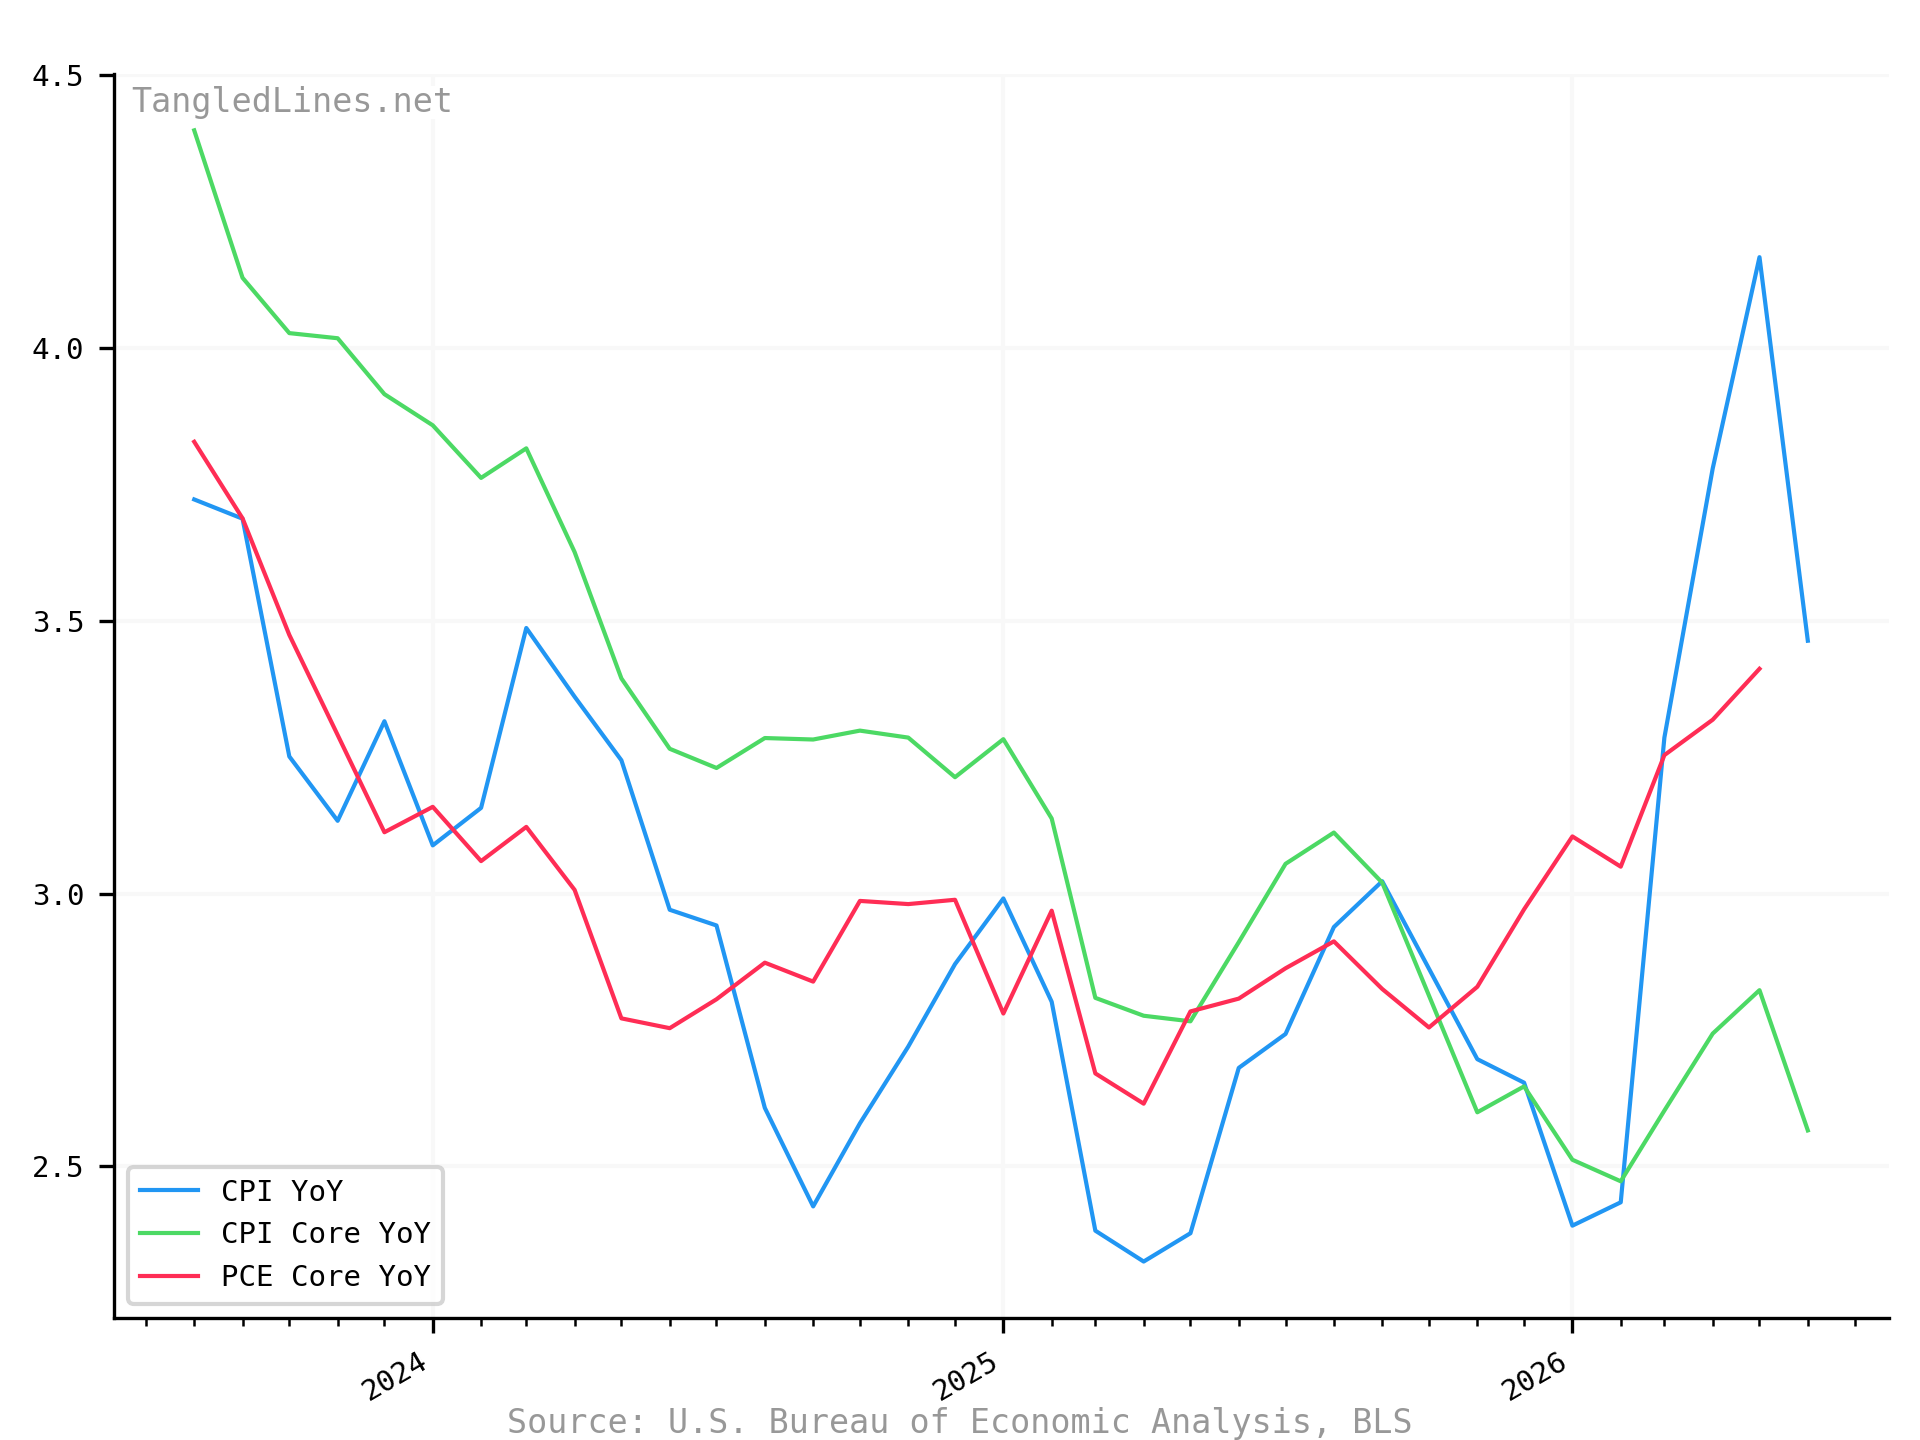
| Series | Latest | Date |
|---|---|---|
| CPI YoY | 3.46 | 2026-06-01
Reported 2026-07-14 |
| CPI Core YoY | 2.57 | 2026-06-01
Reported 2026-07-14 |
| PCE Core YoY | 3.41 | 2026-05-01
Reported 2026-06-25 |
CPI MoM
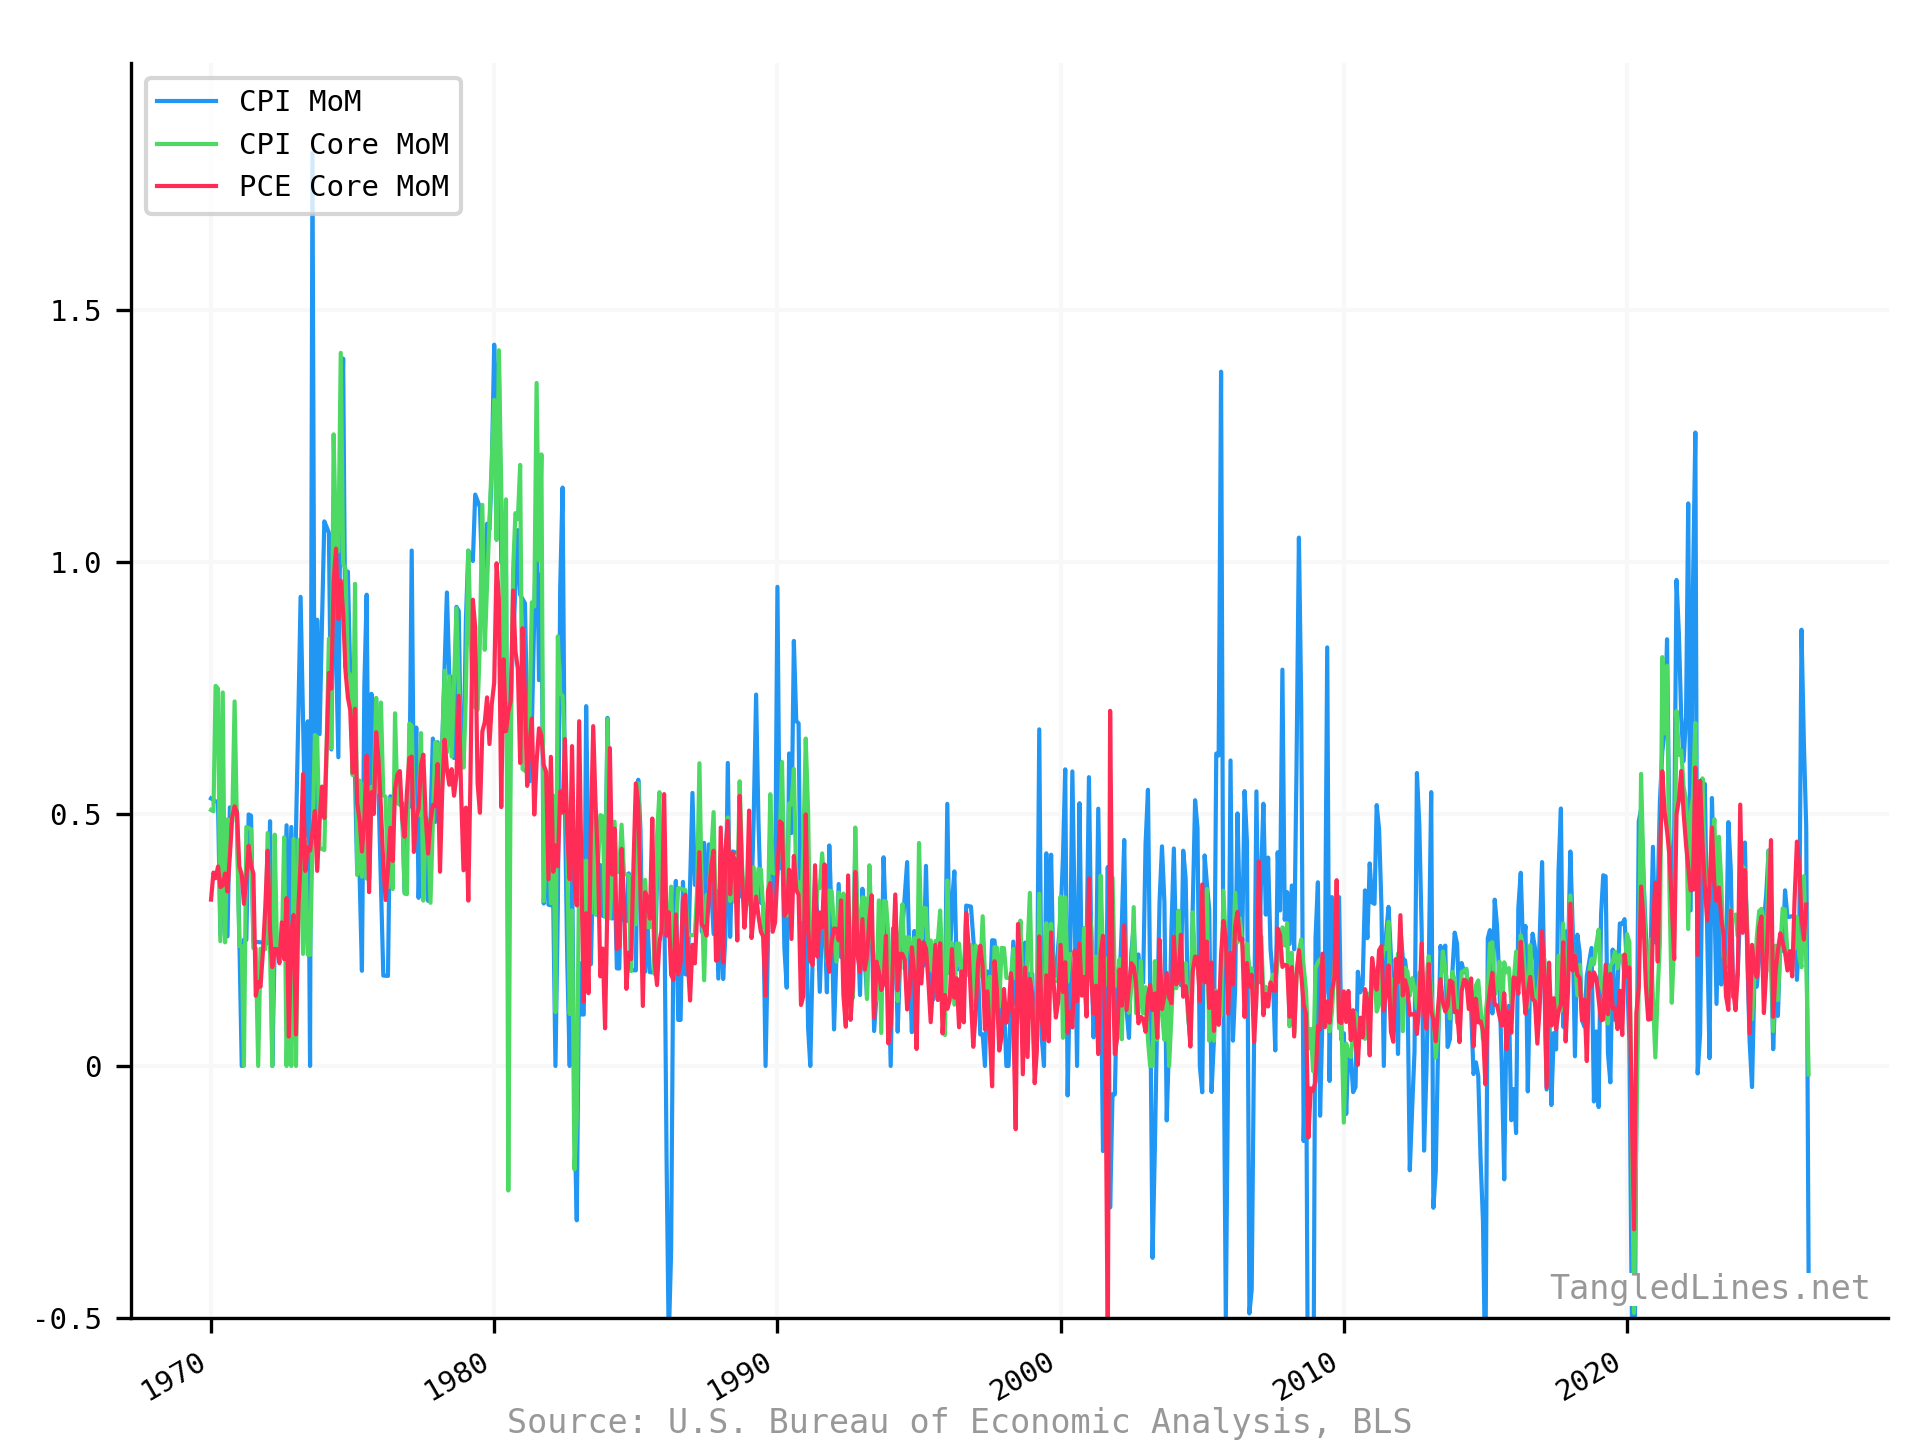

| Series | Latest | Date |
|---|---|---|
| CPI MoM | -0.42 | 2026-06-01
Reported 2026-07-14 |
| CPI Core MoM | -0.02 | 2026-06-01
Reported 2026-07-14 |
| PCE Core MoM | 0.32 | 2026-05-01
Reported 2026-06-25 |
PPI YoY
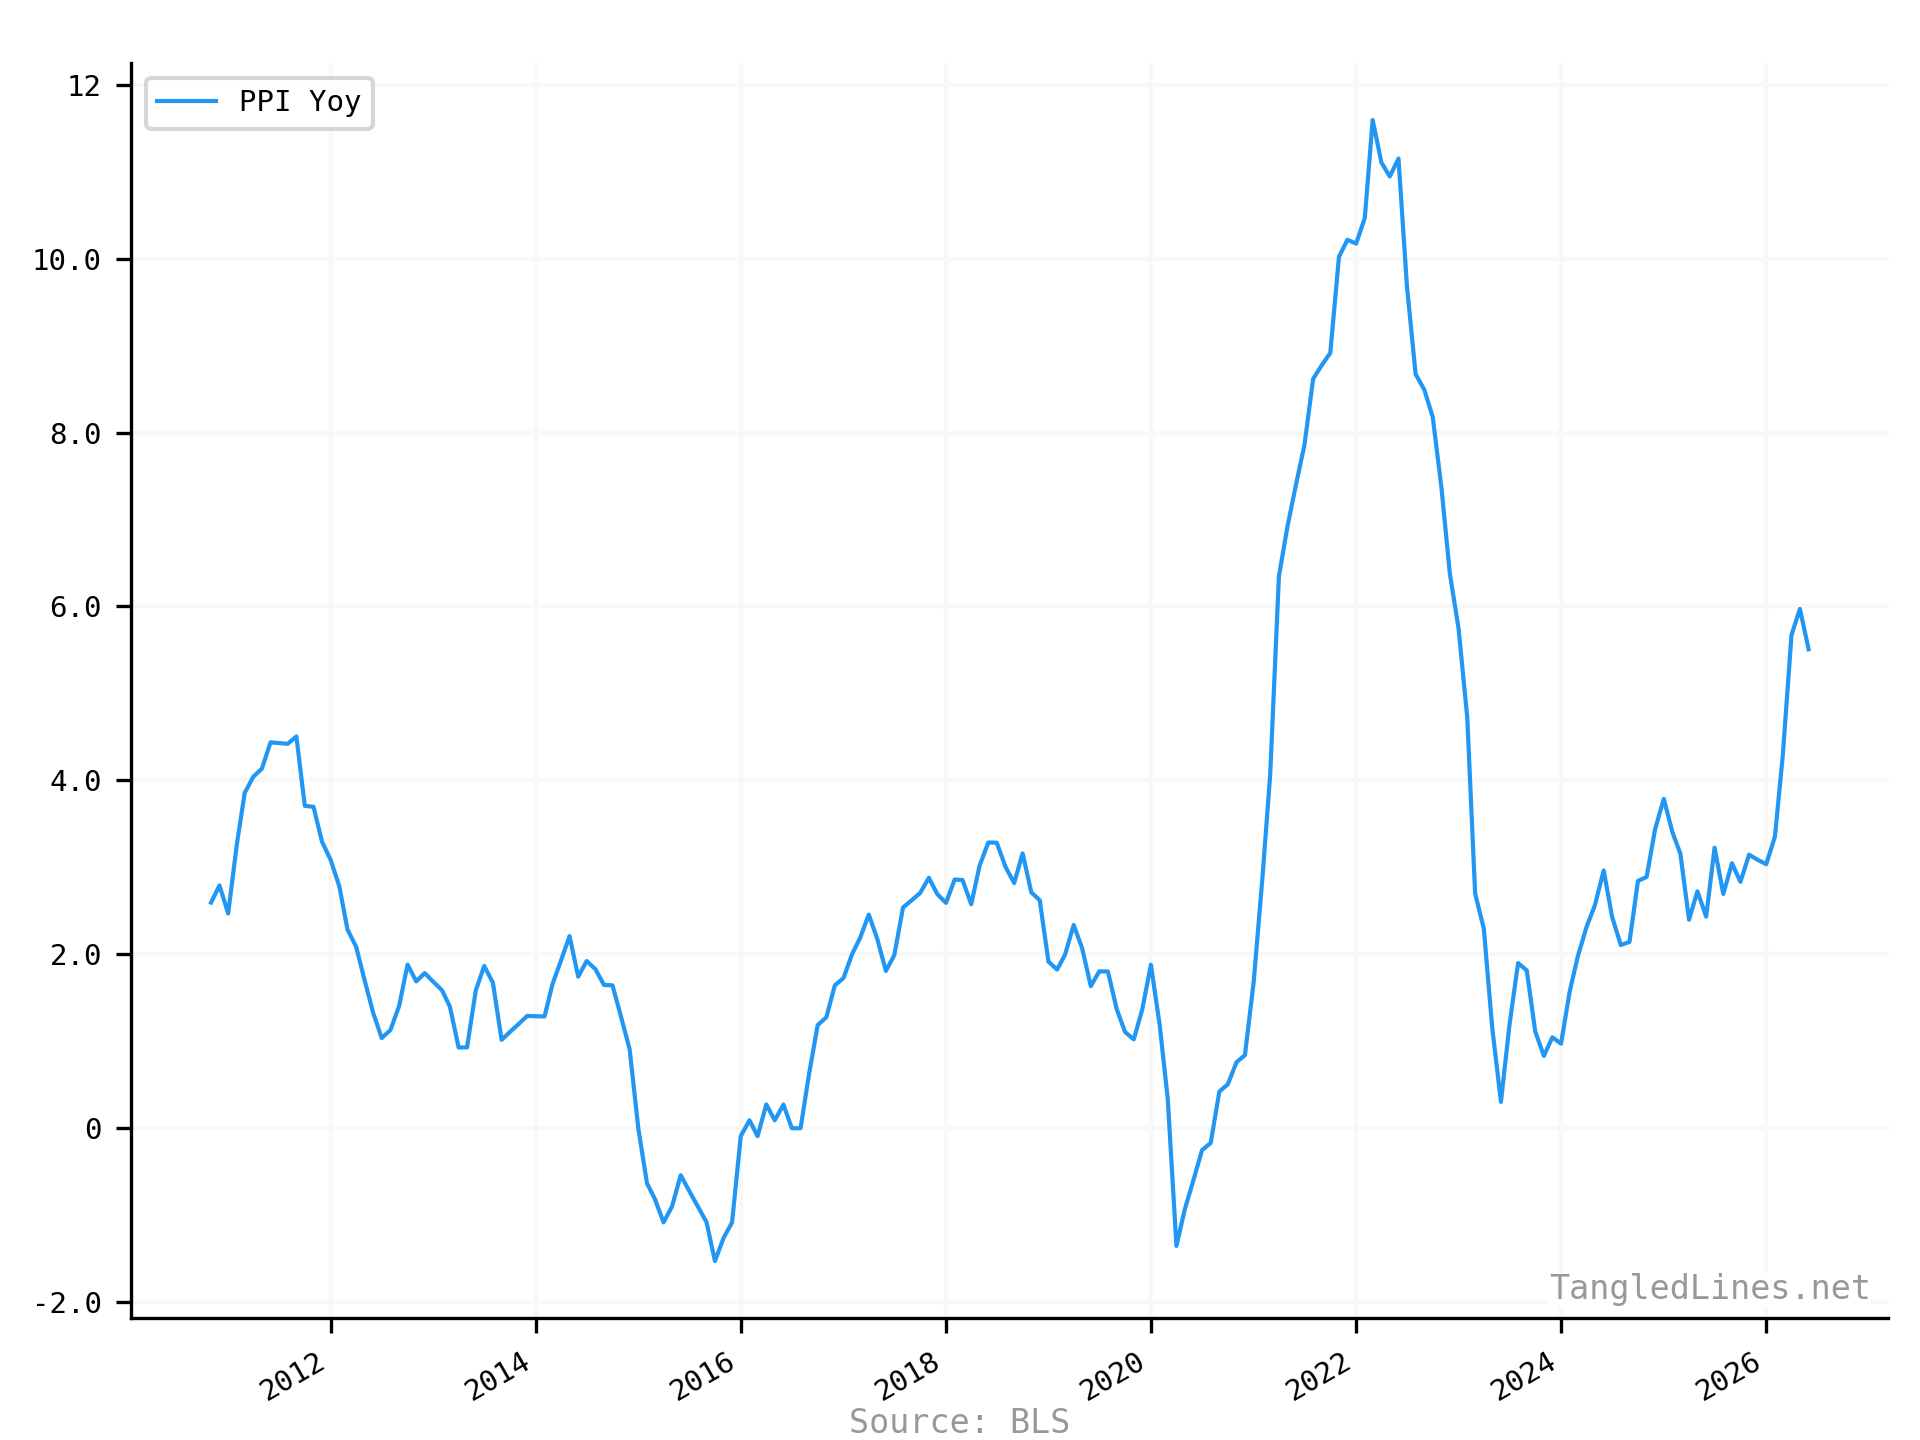
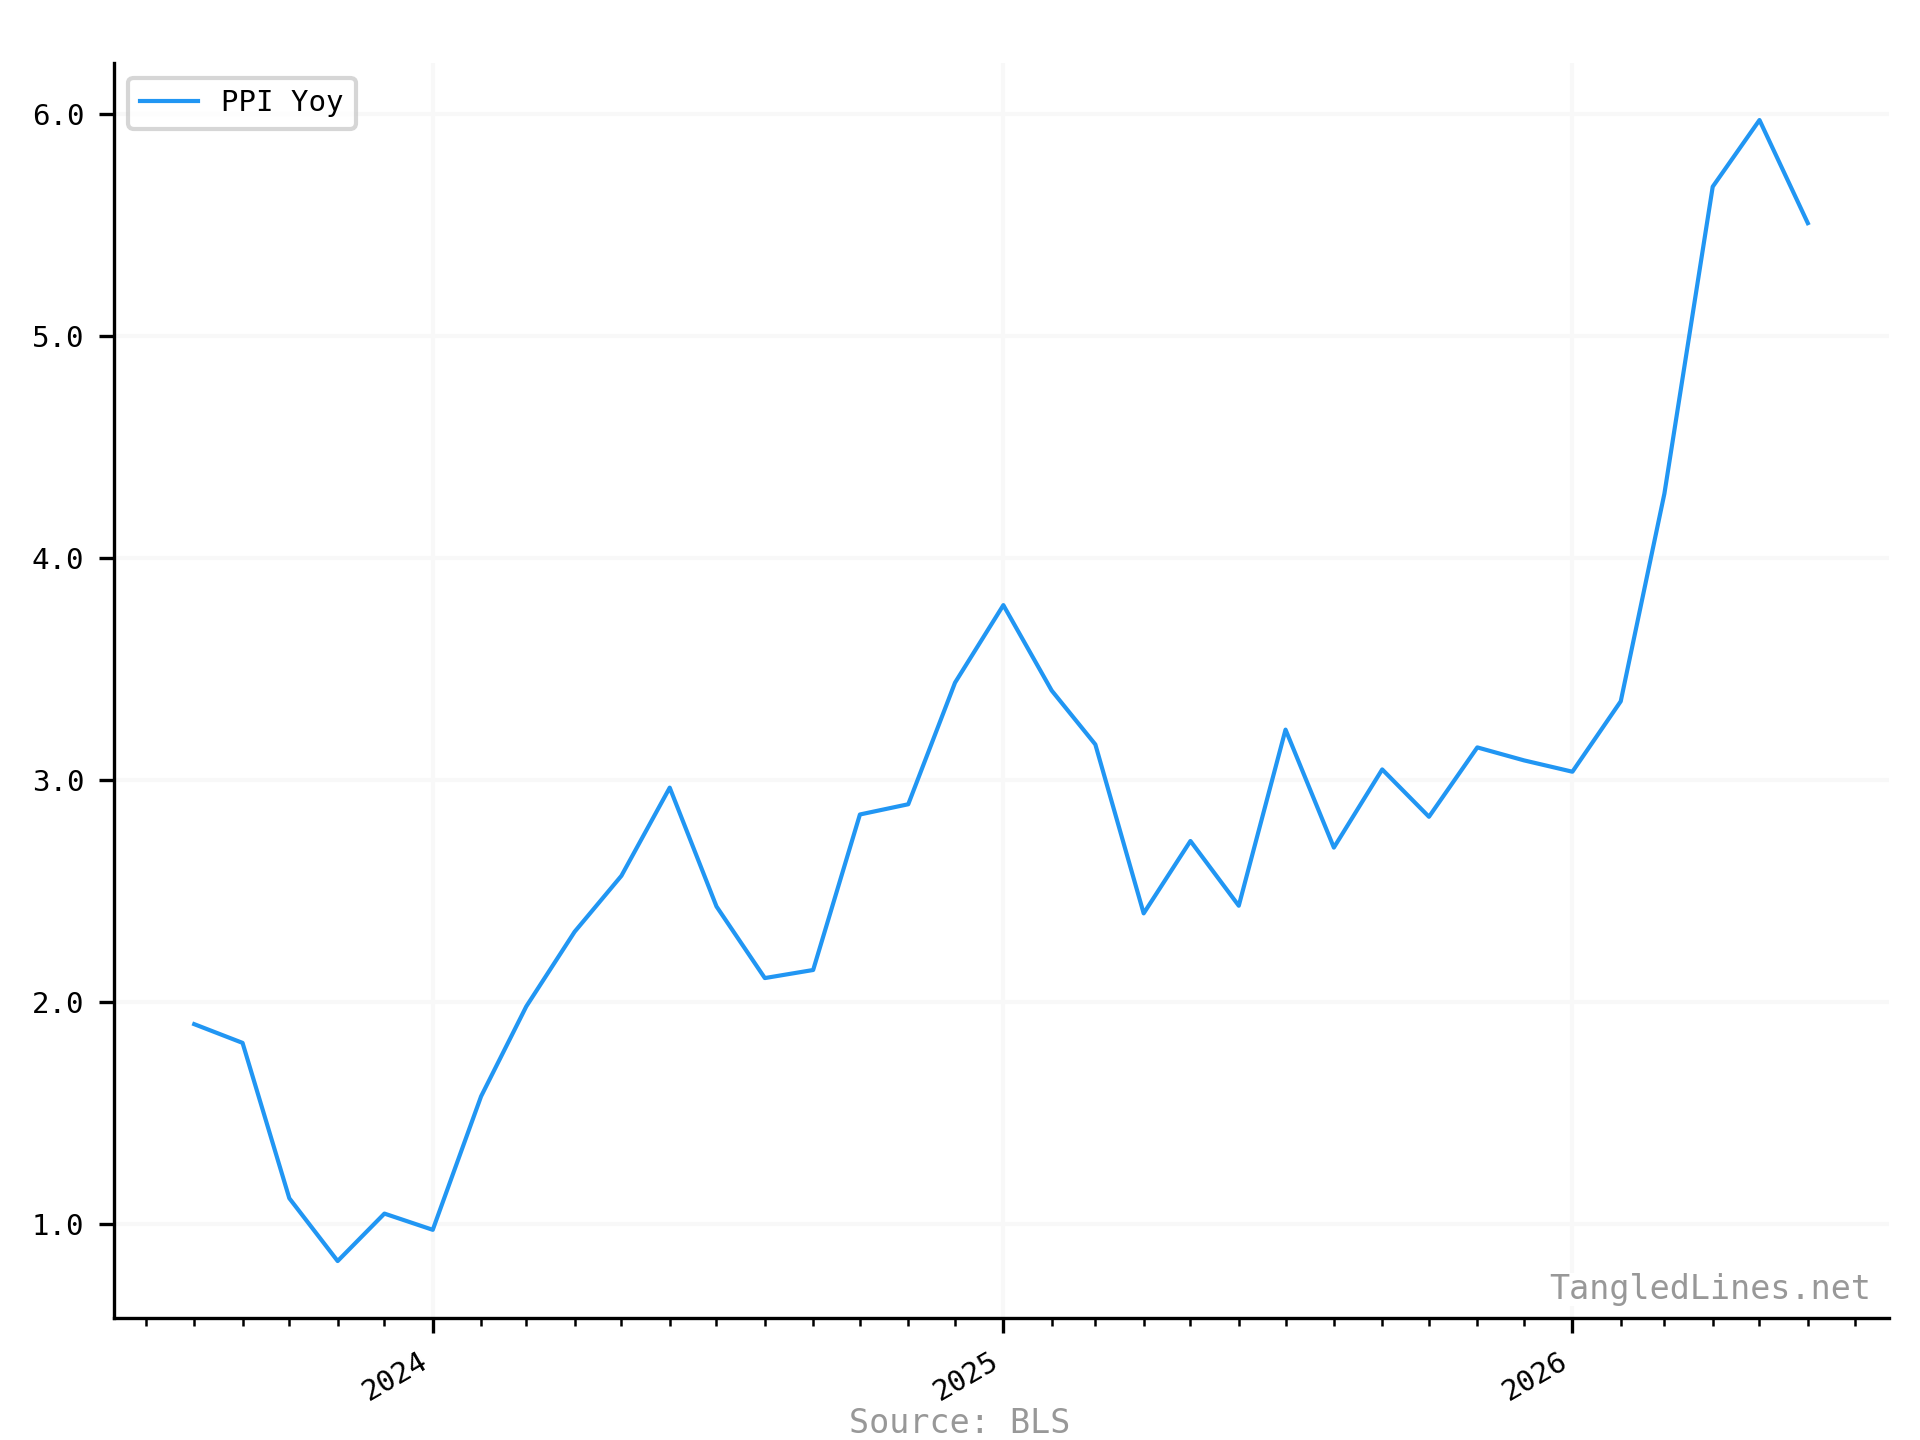
| Series | Latest | Date |
|---|---|---|
| PPI Yoy | 5.51 | 2026-06-01
Reported 2026-07-15 |
Inflation Expectations
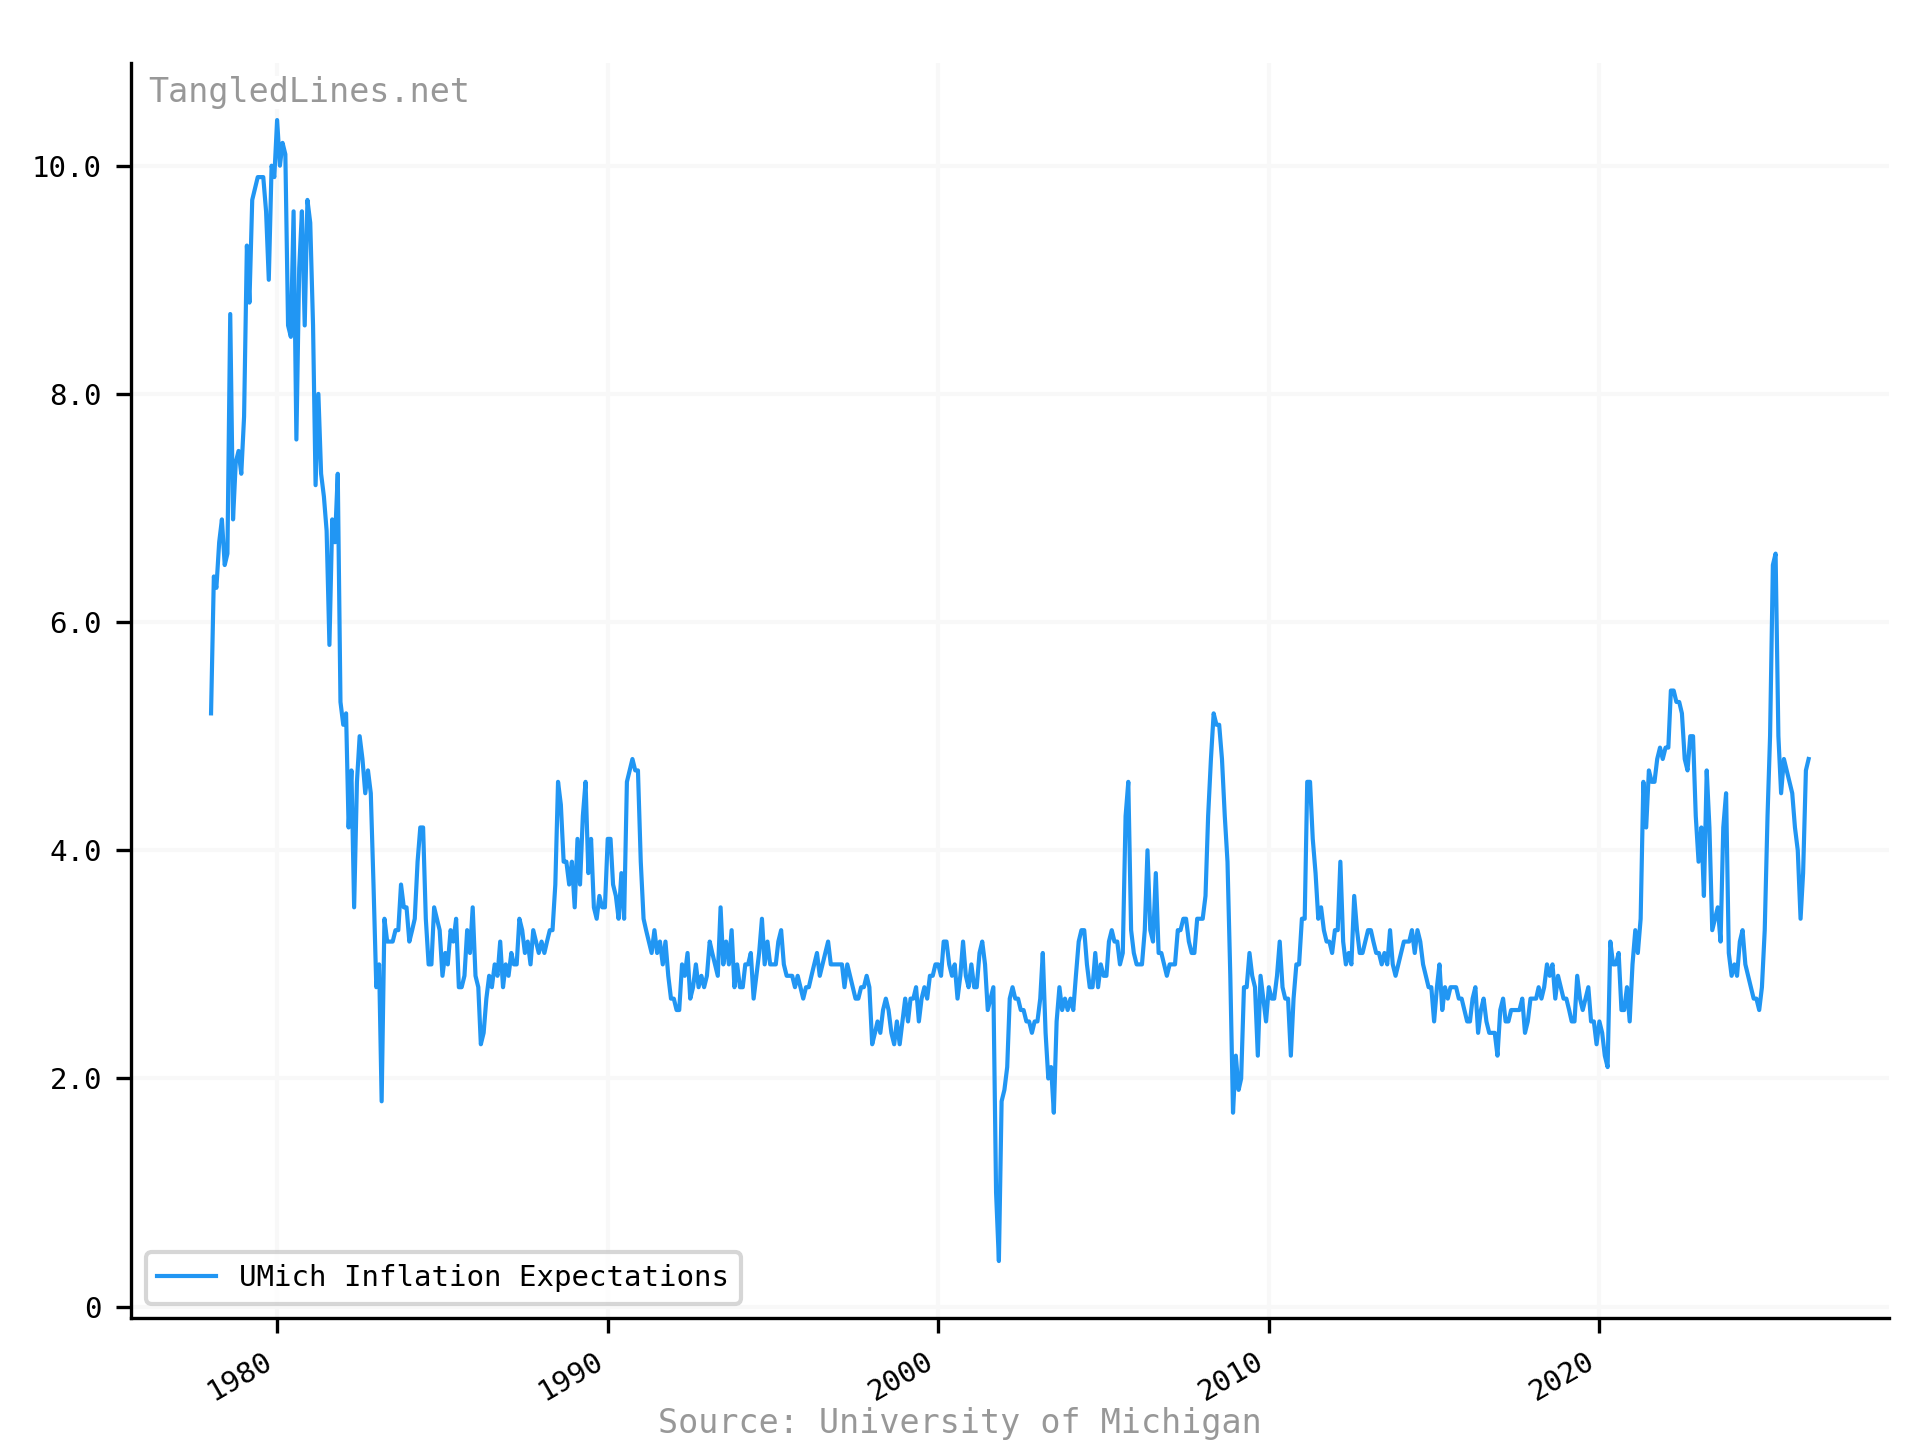
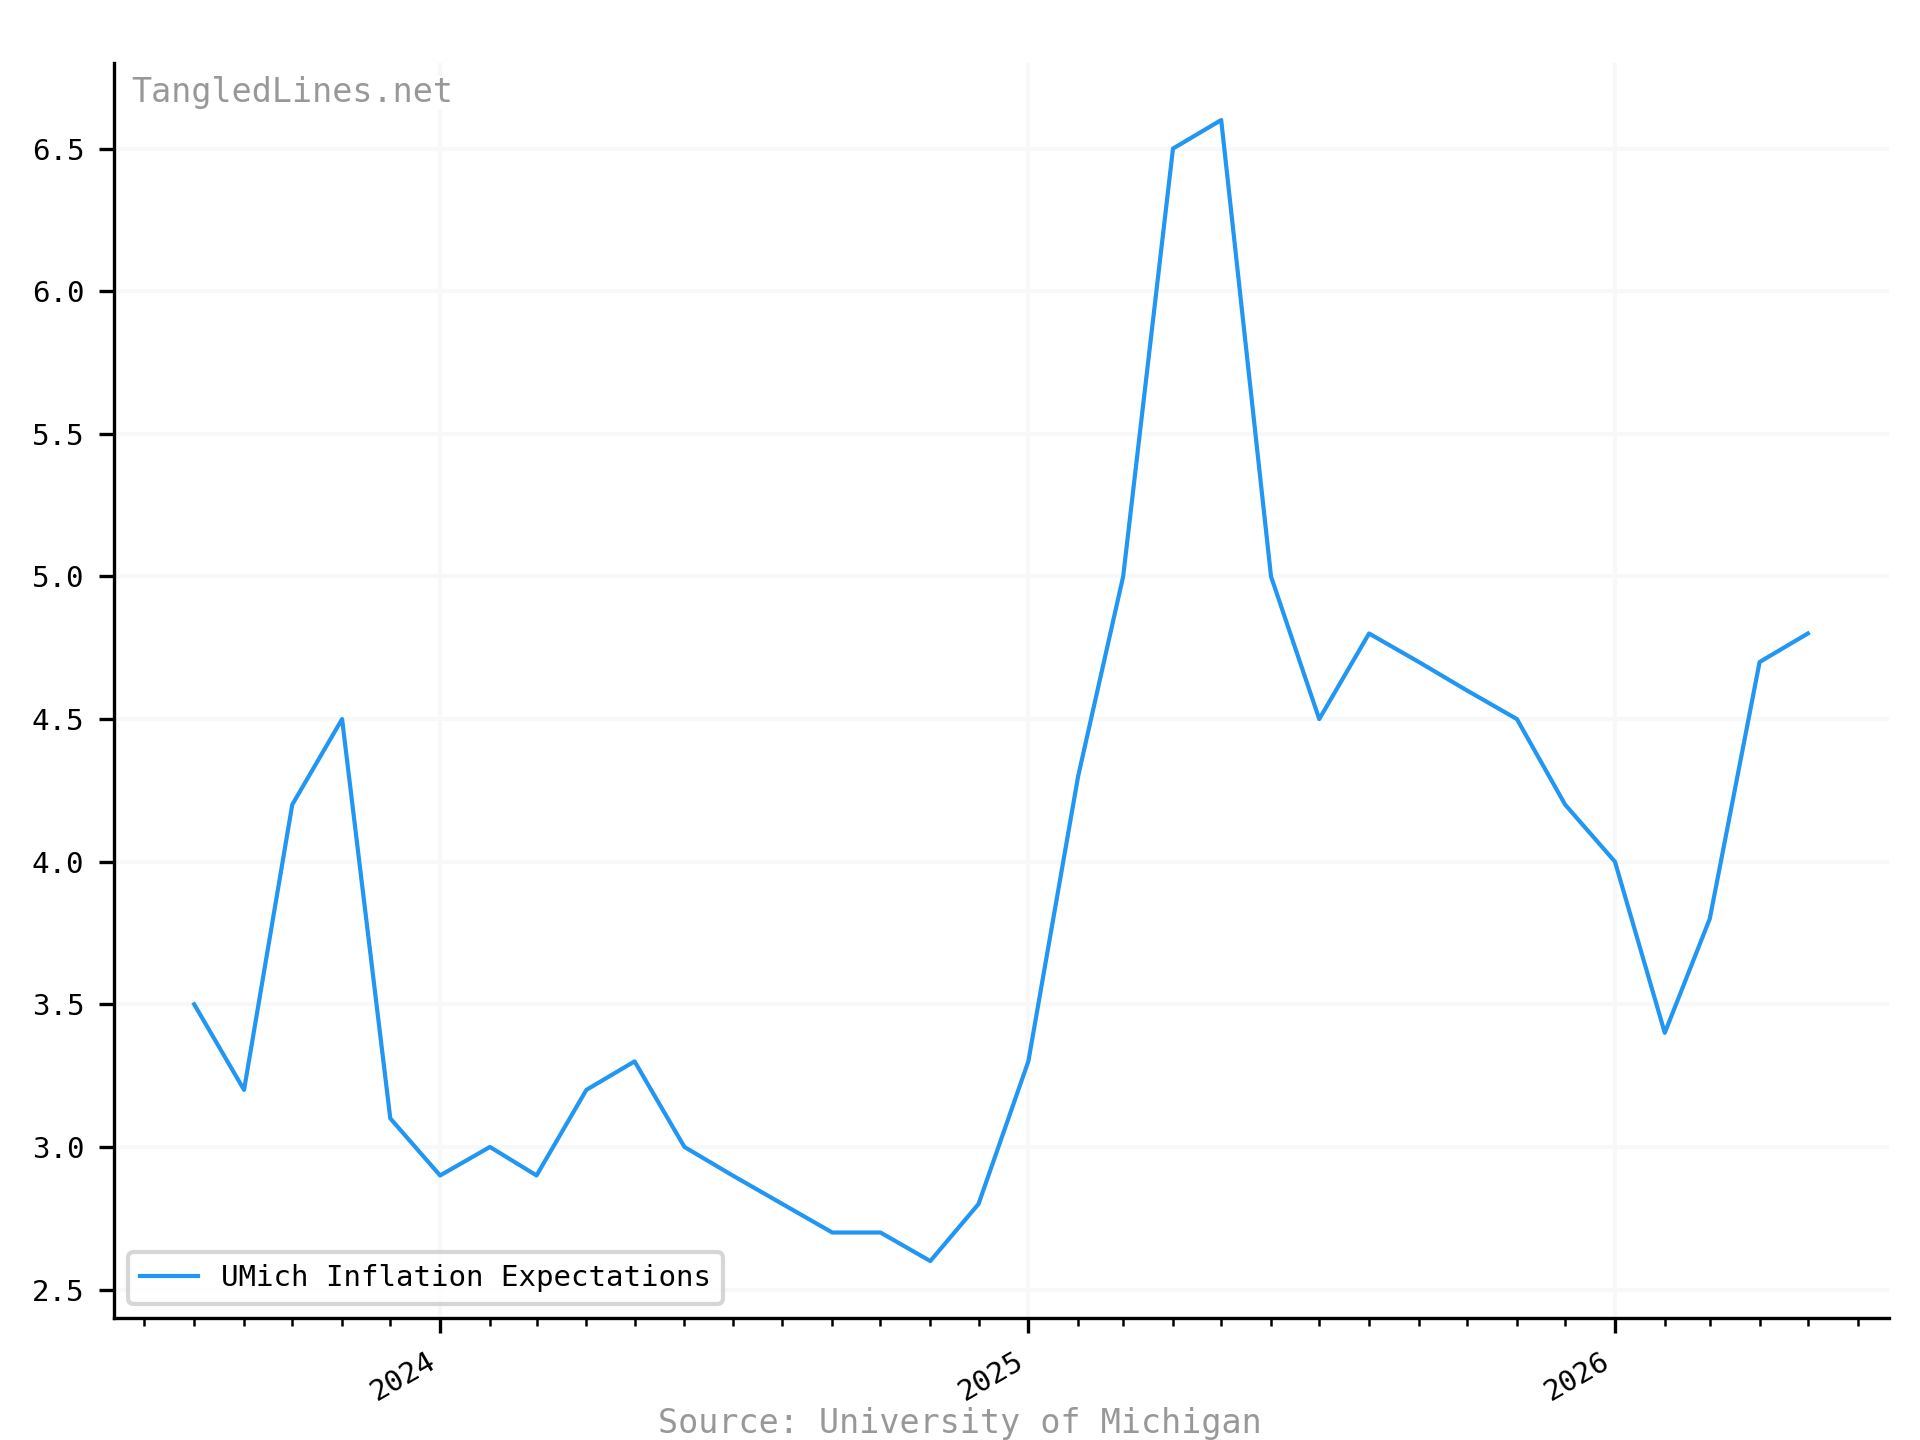
| Series | Latest | Date |
|---|---|---|
| UMich Inflation Expectations | 4.80 | 2026-05-01
Reported 2026-06-26 |
Employment
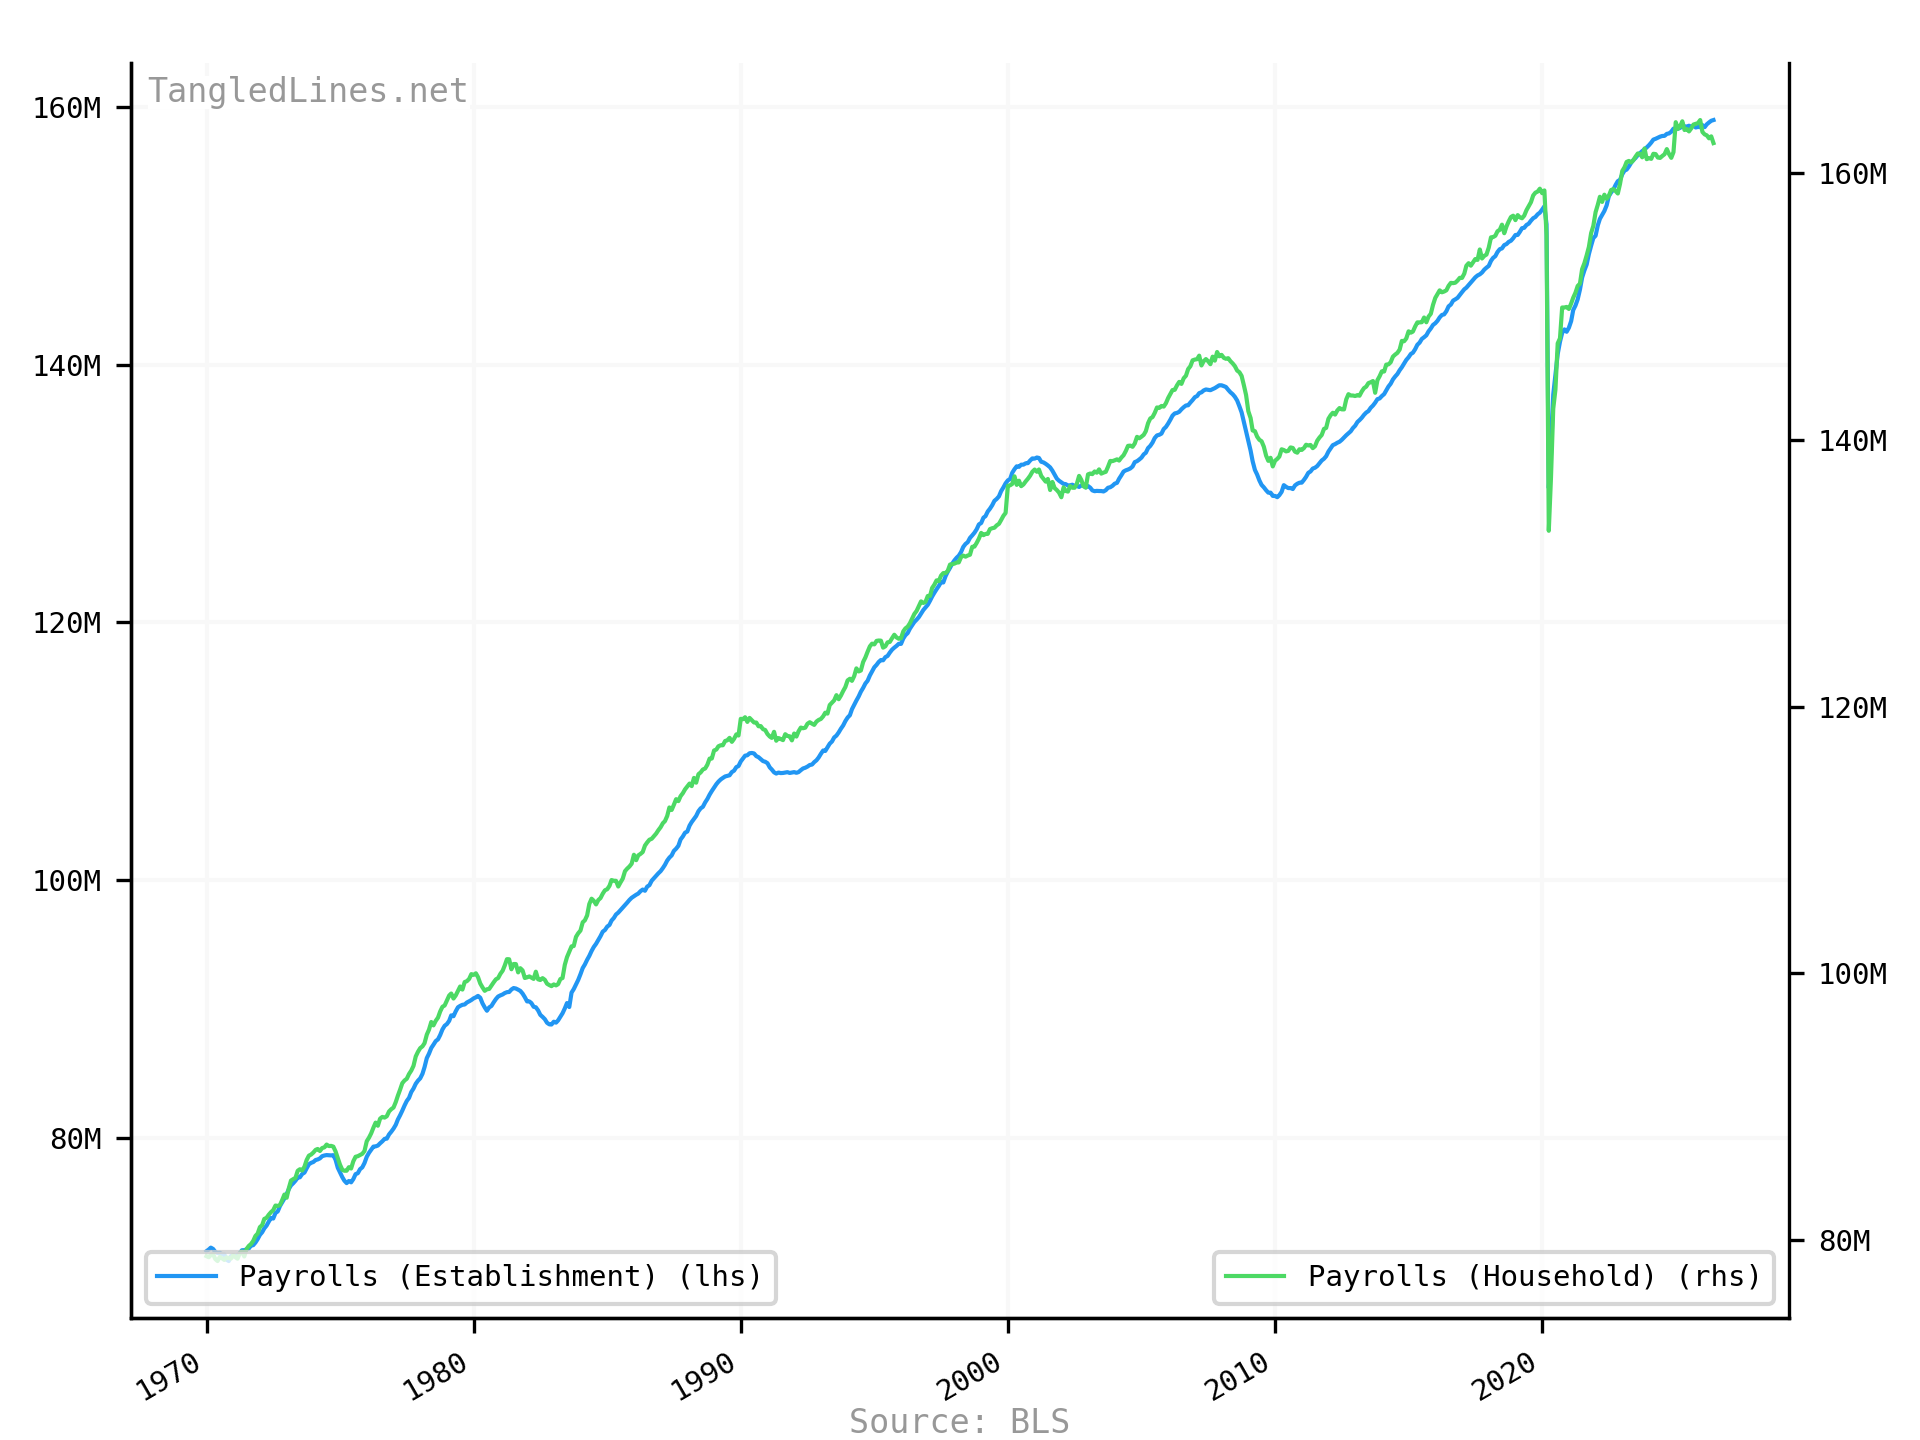
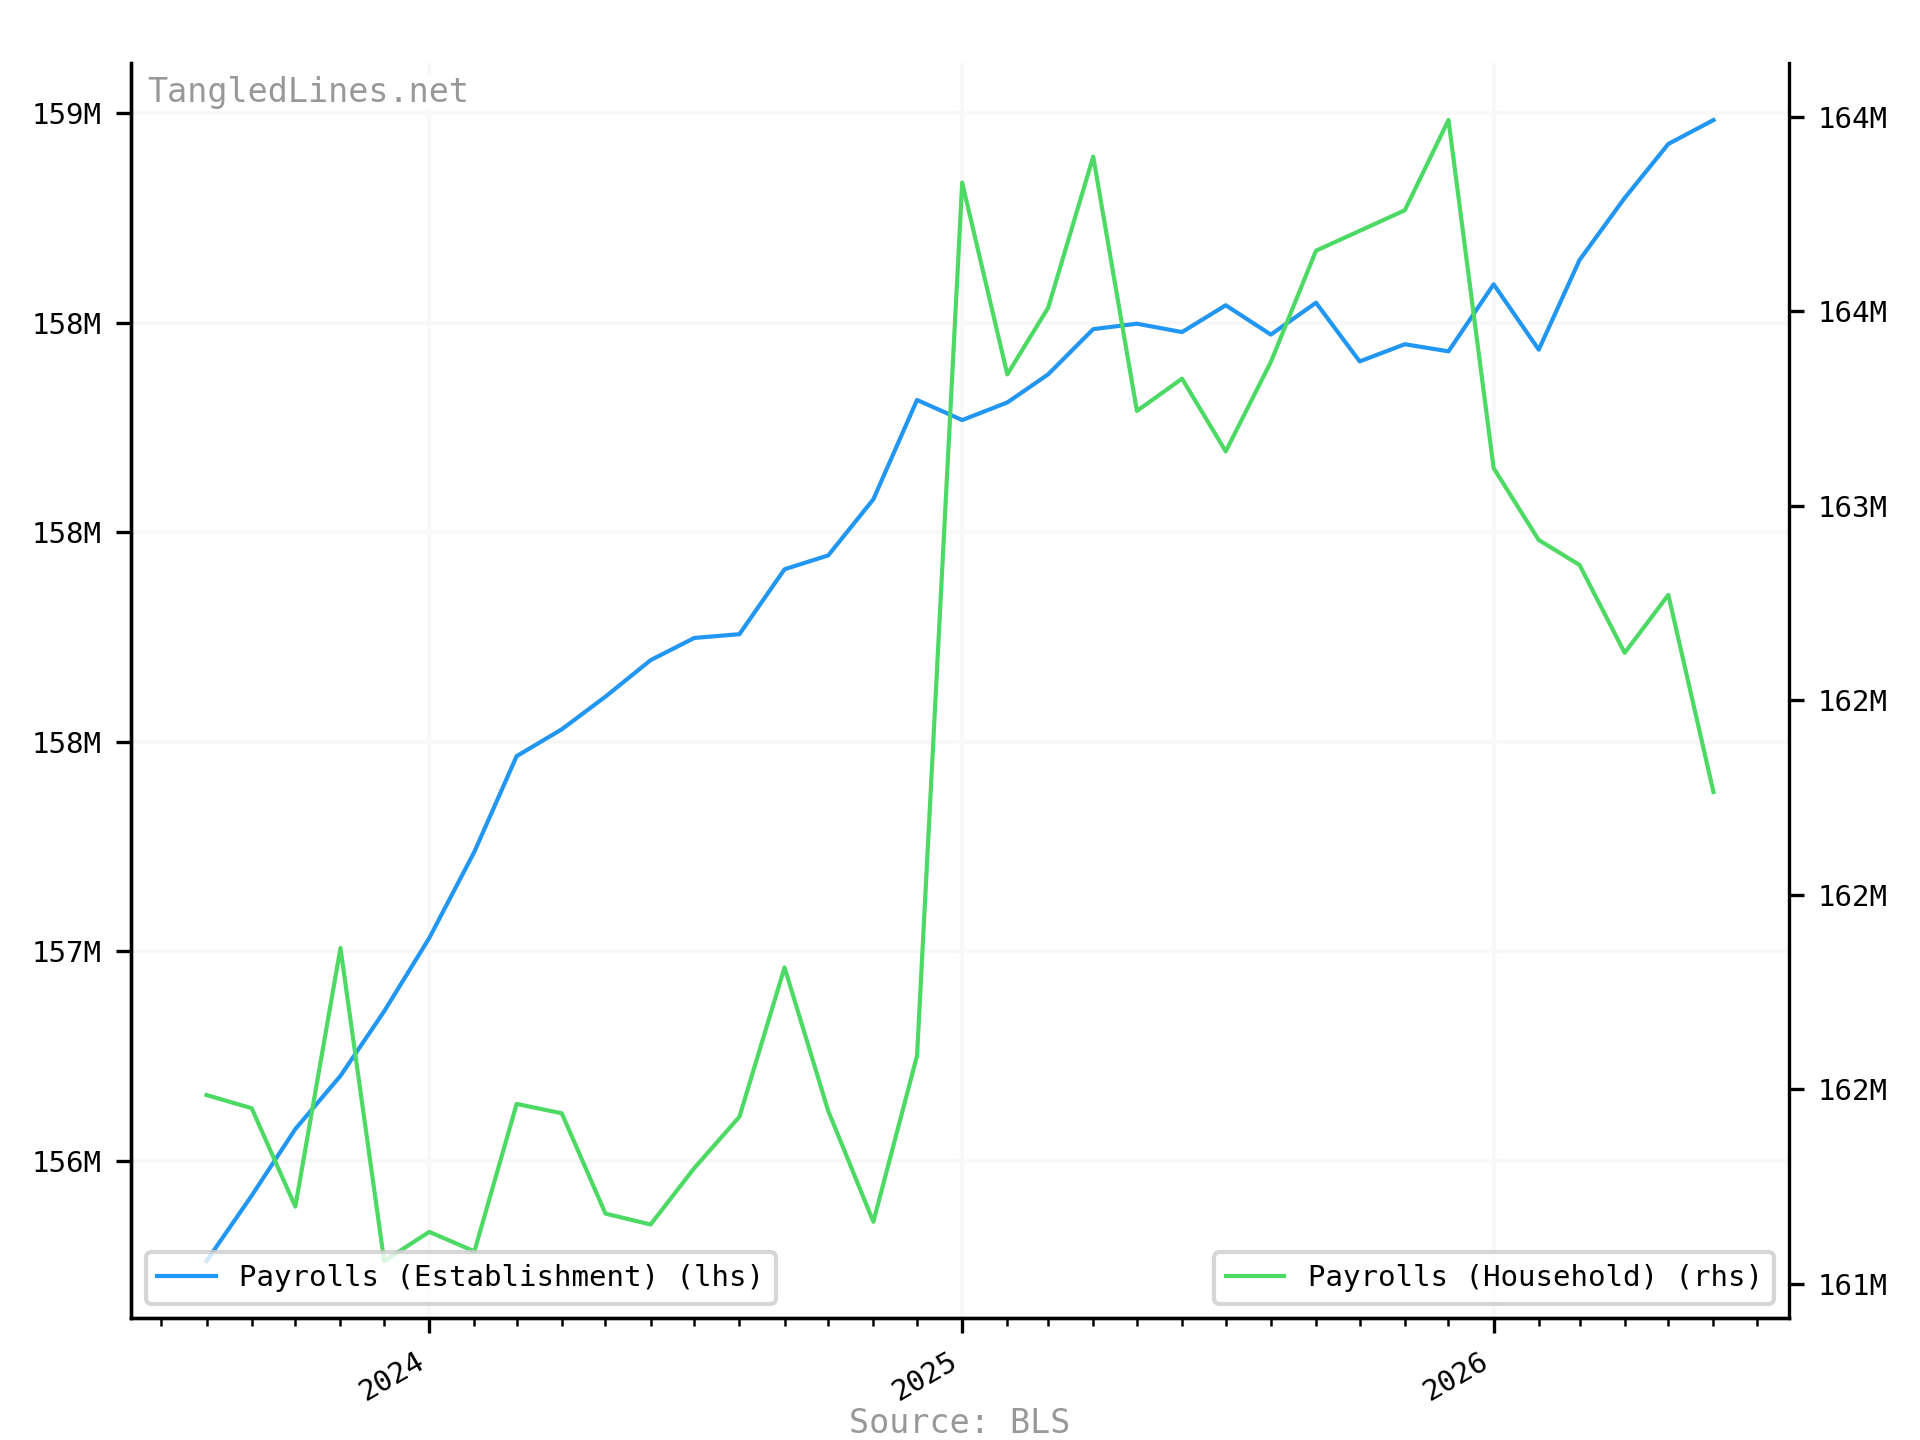
Payrolls
| Series | Latest | Date |
|---|---|---|
| Payrolls (Establishment) | 159M | 2026-06-01
Reported 2026-07-02 |
| Payrolls (Household) | 162M | 2026-06-01
Reported 2026-07-02 |
Money
Money Supply
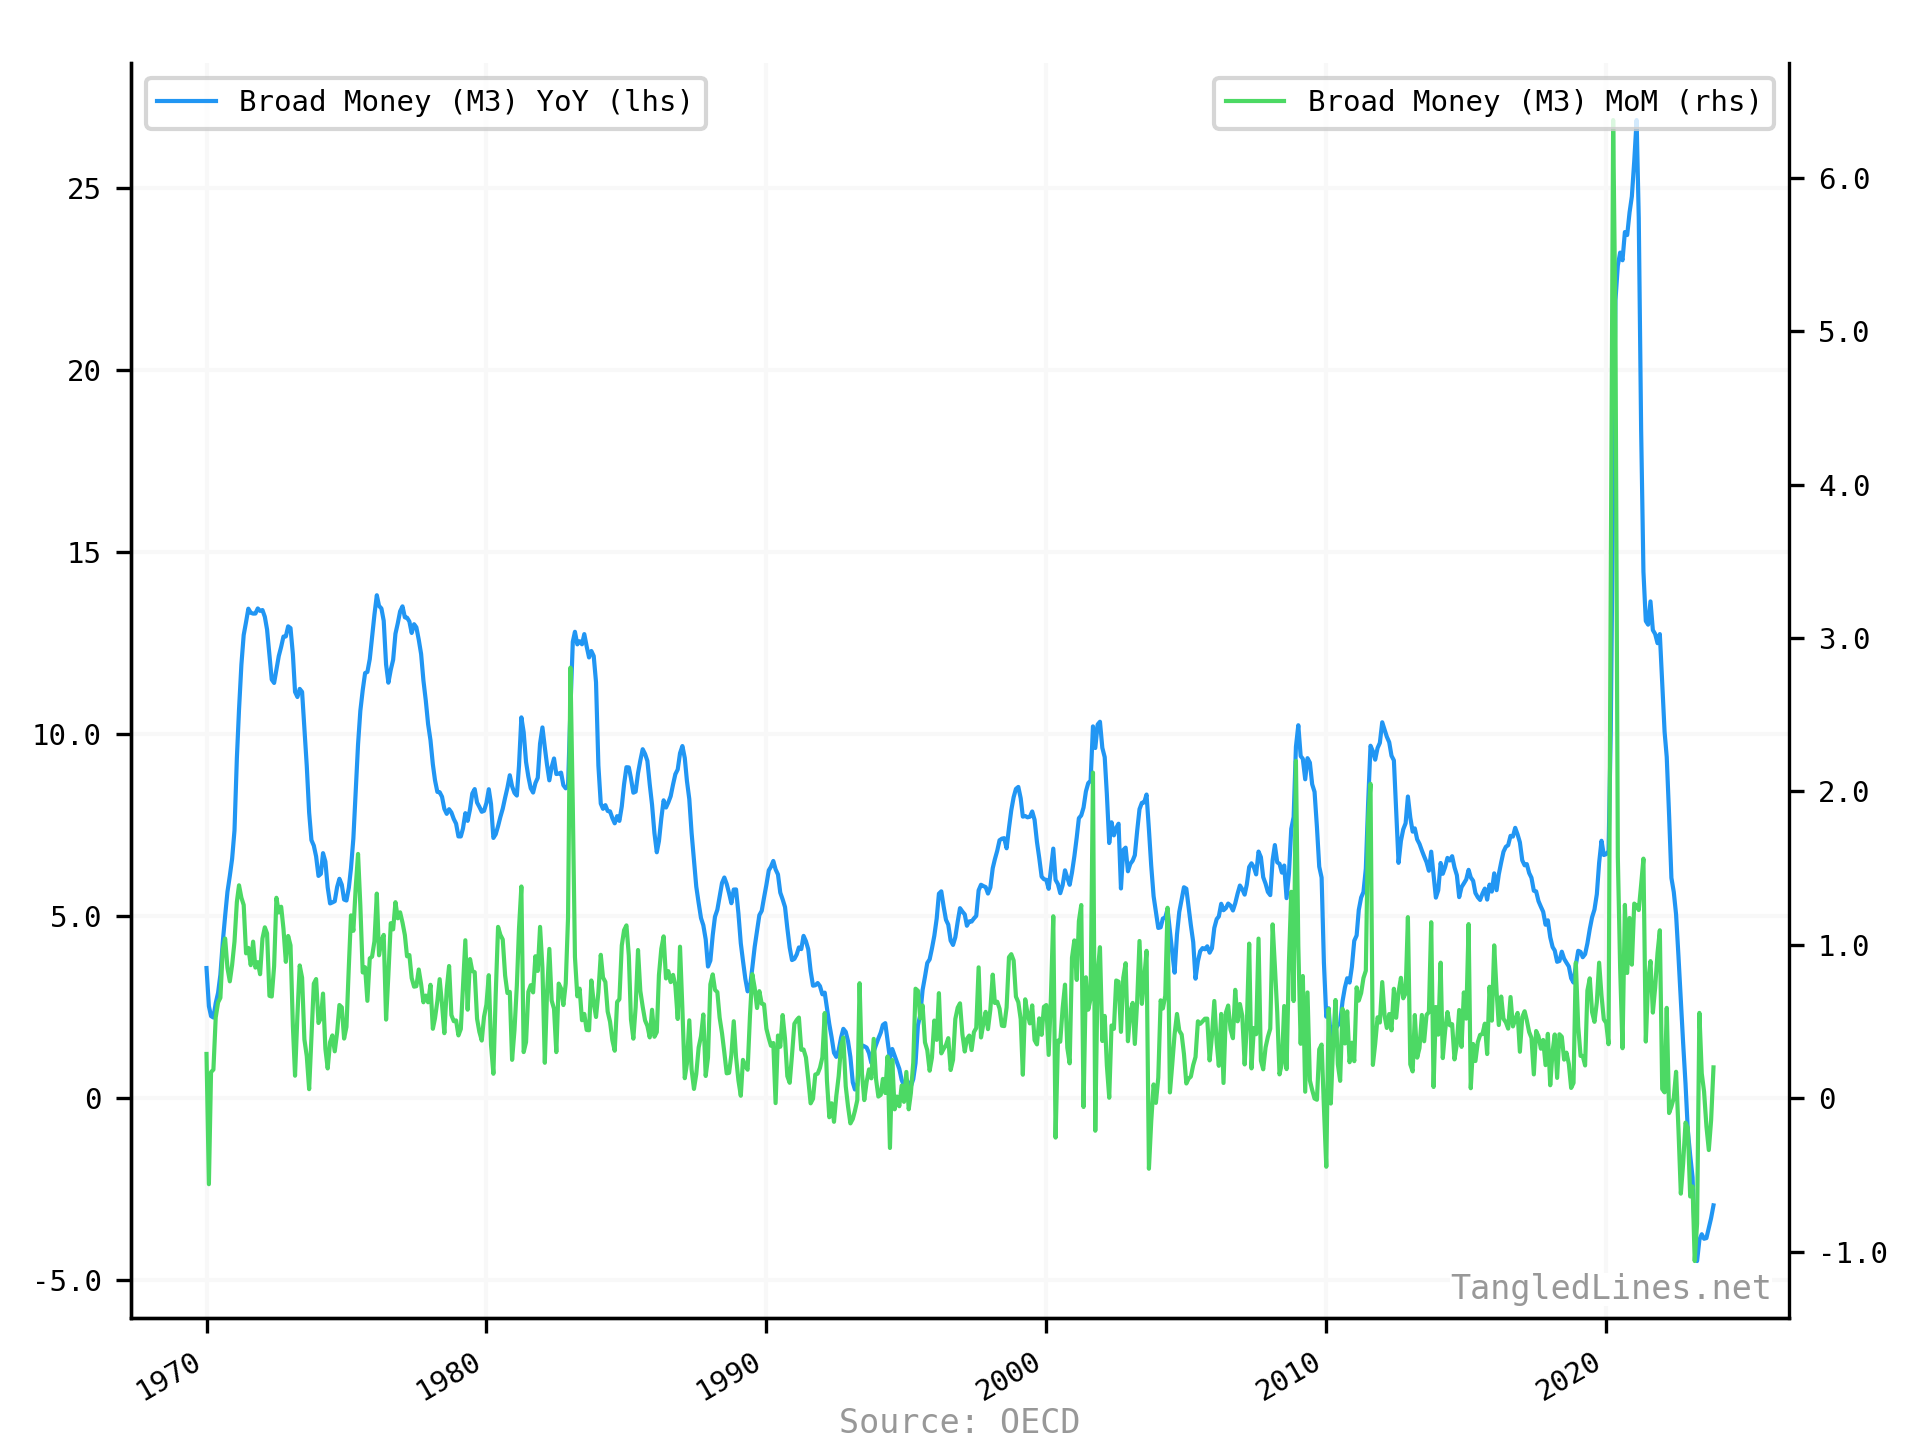
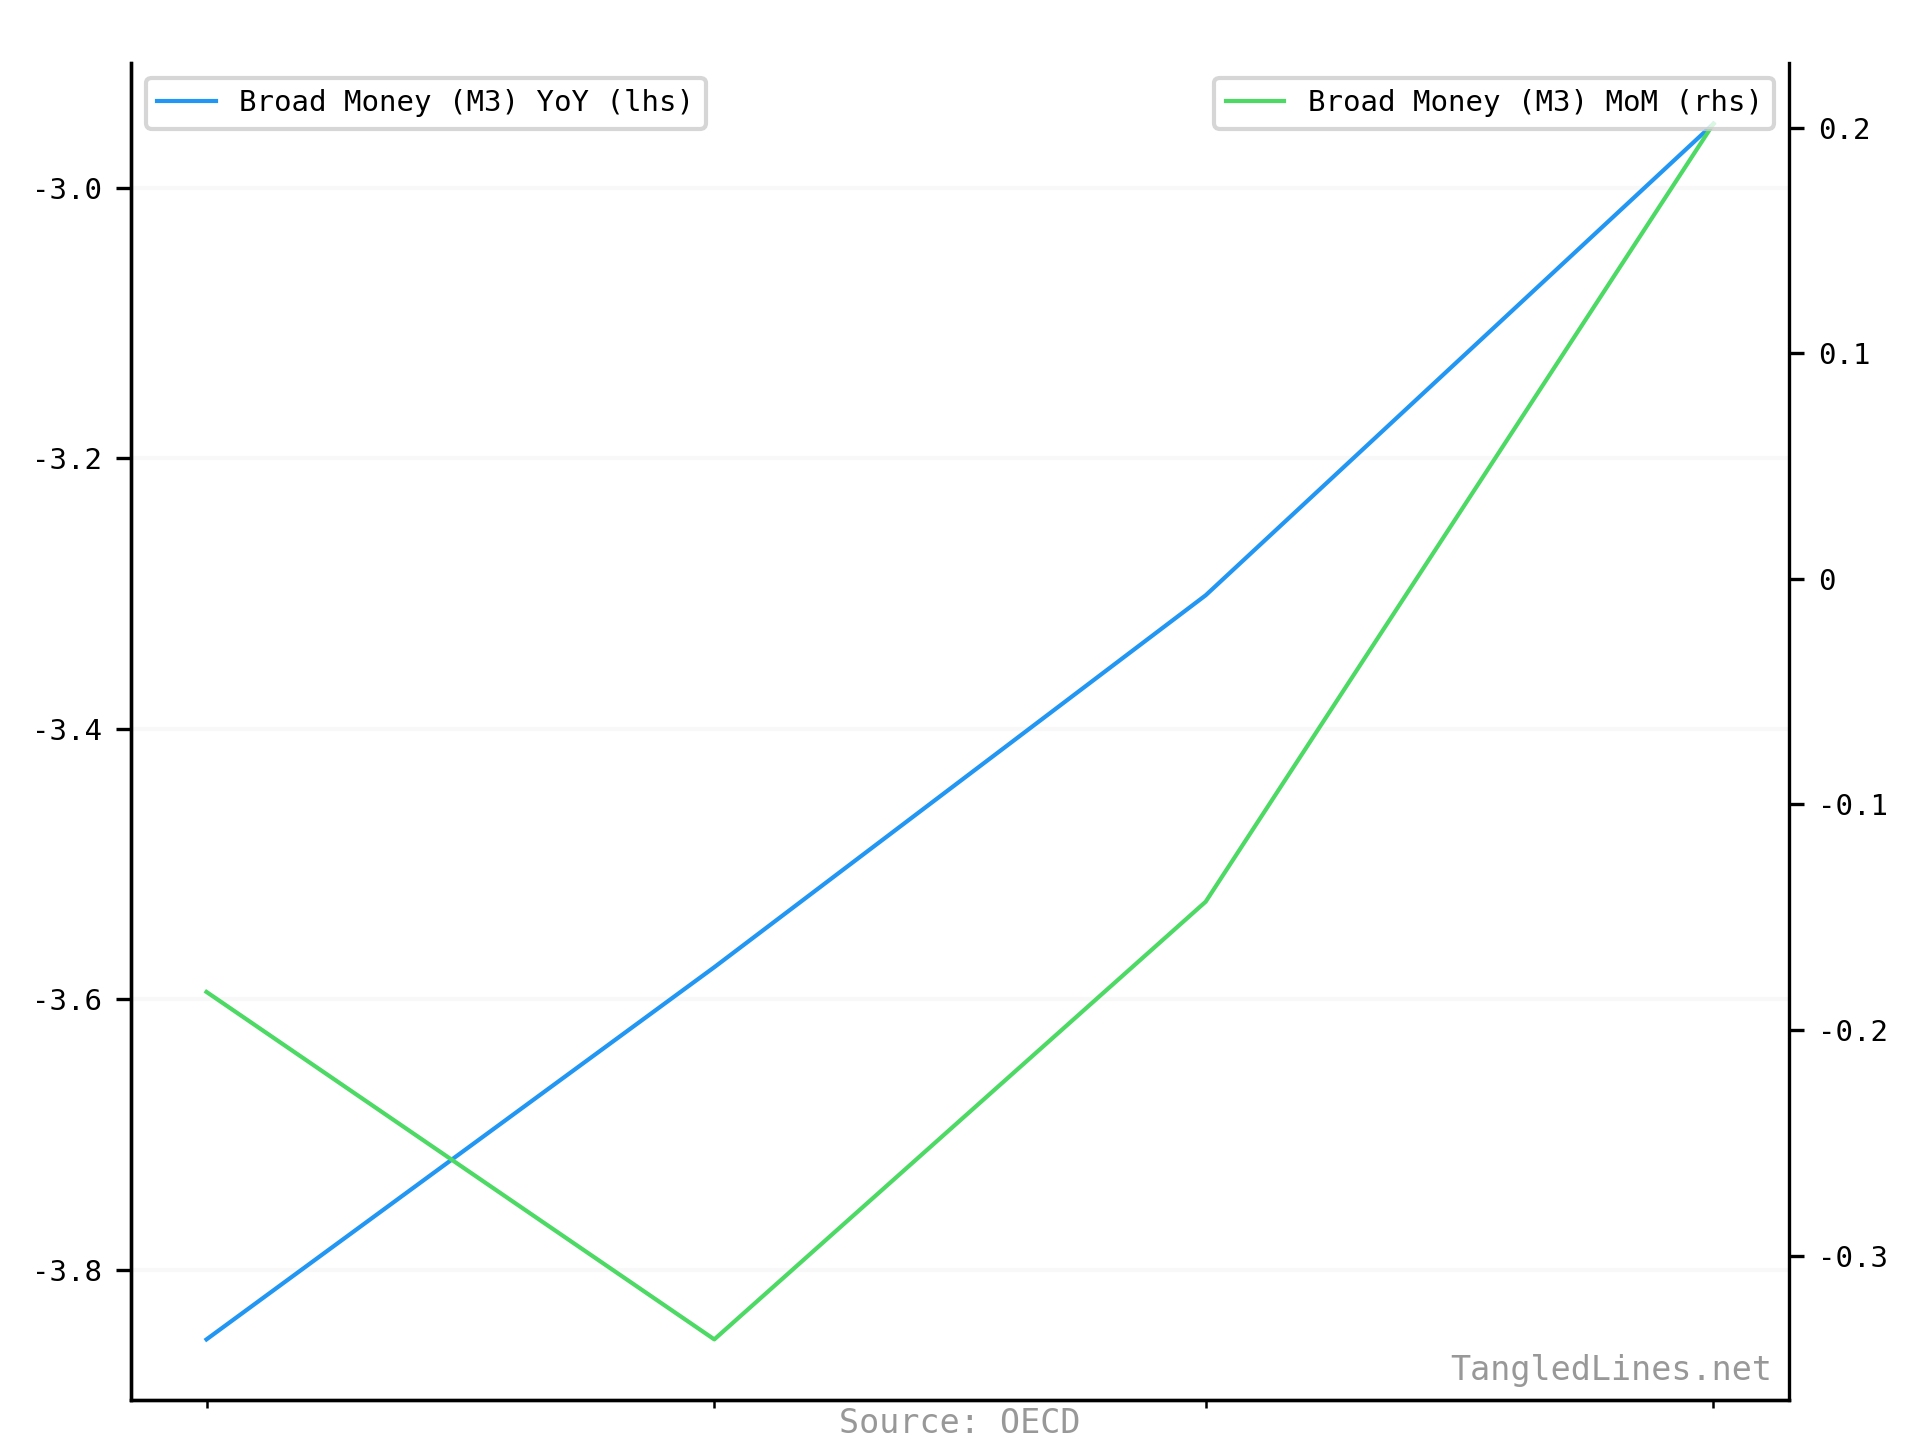
| Series | Latest | Date |
|---|---|---|
| Broad Money (M3) YoY | -2.95 | 2023-11-01
Reported 2024-01-12 |
| Broad Money (M3) MoM | 0.20 | 2023-11-01
Reported 2024-01-12 |
Money Velocity
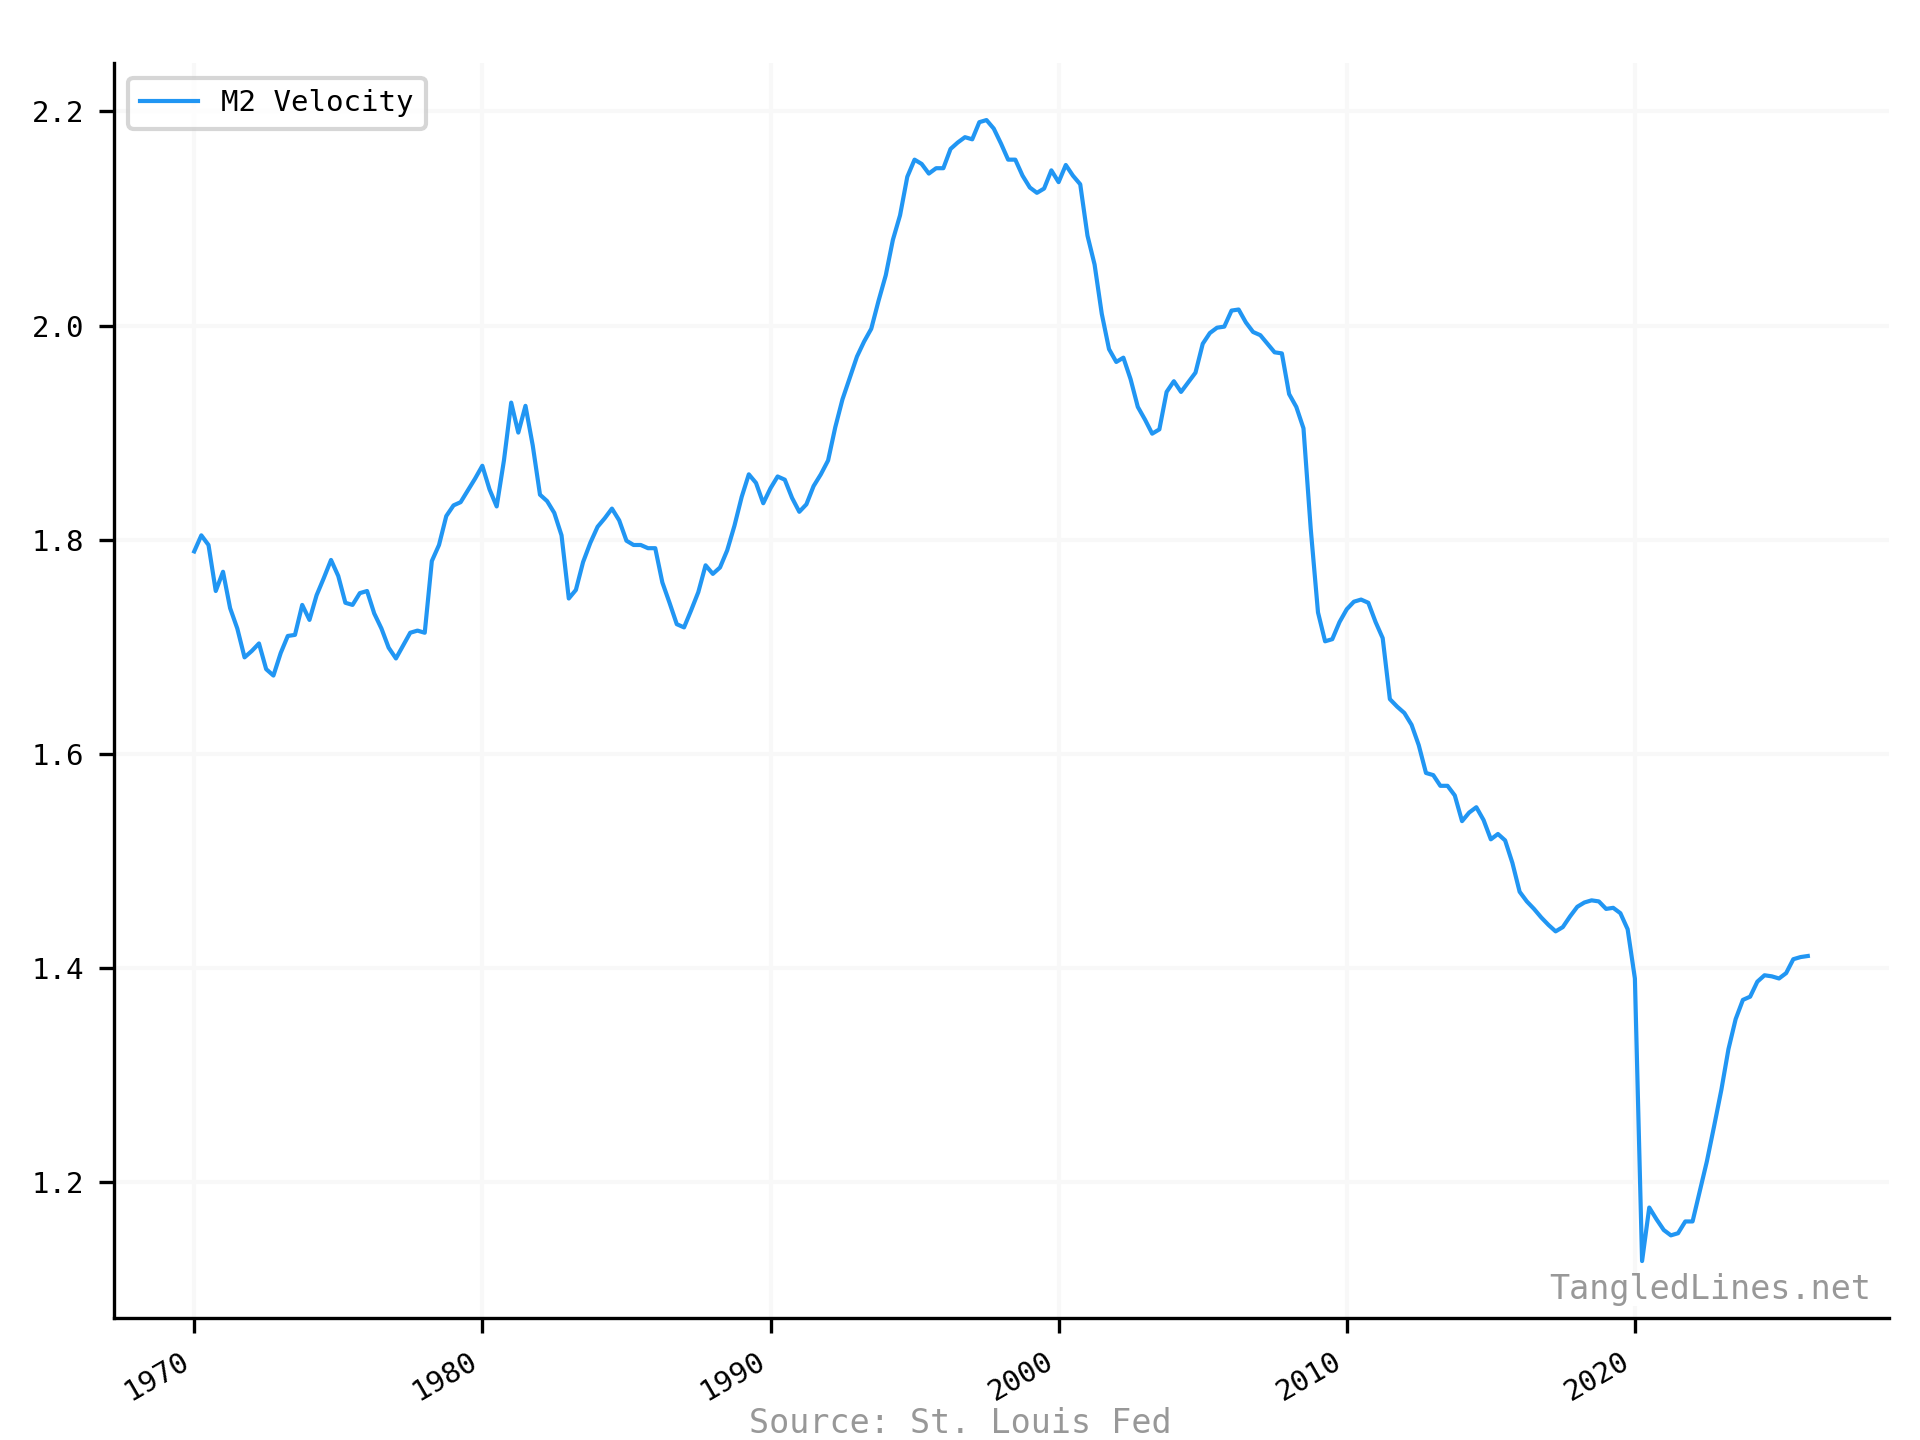

| Series | Latest | Date |
|---|---|---|
| M2 Velocity | 1.41 | 2026-01-01
Reported 2026-06-25 |
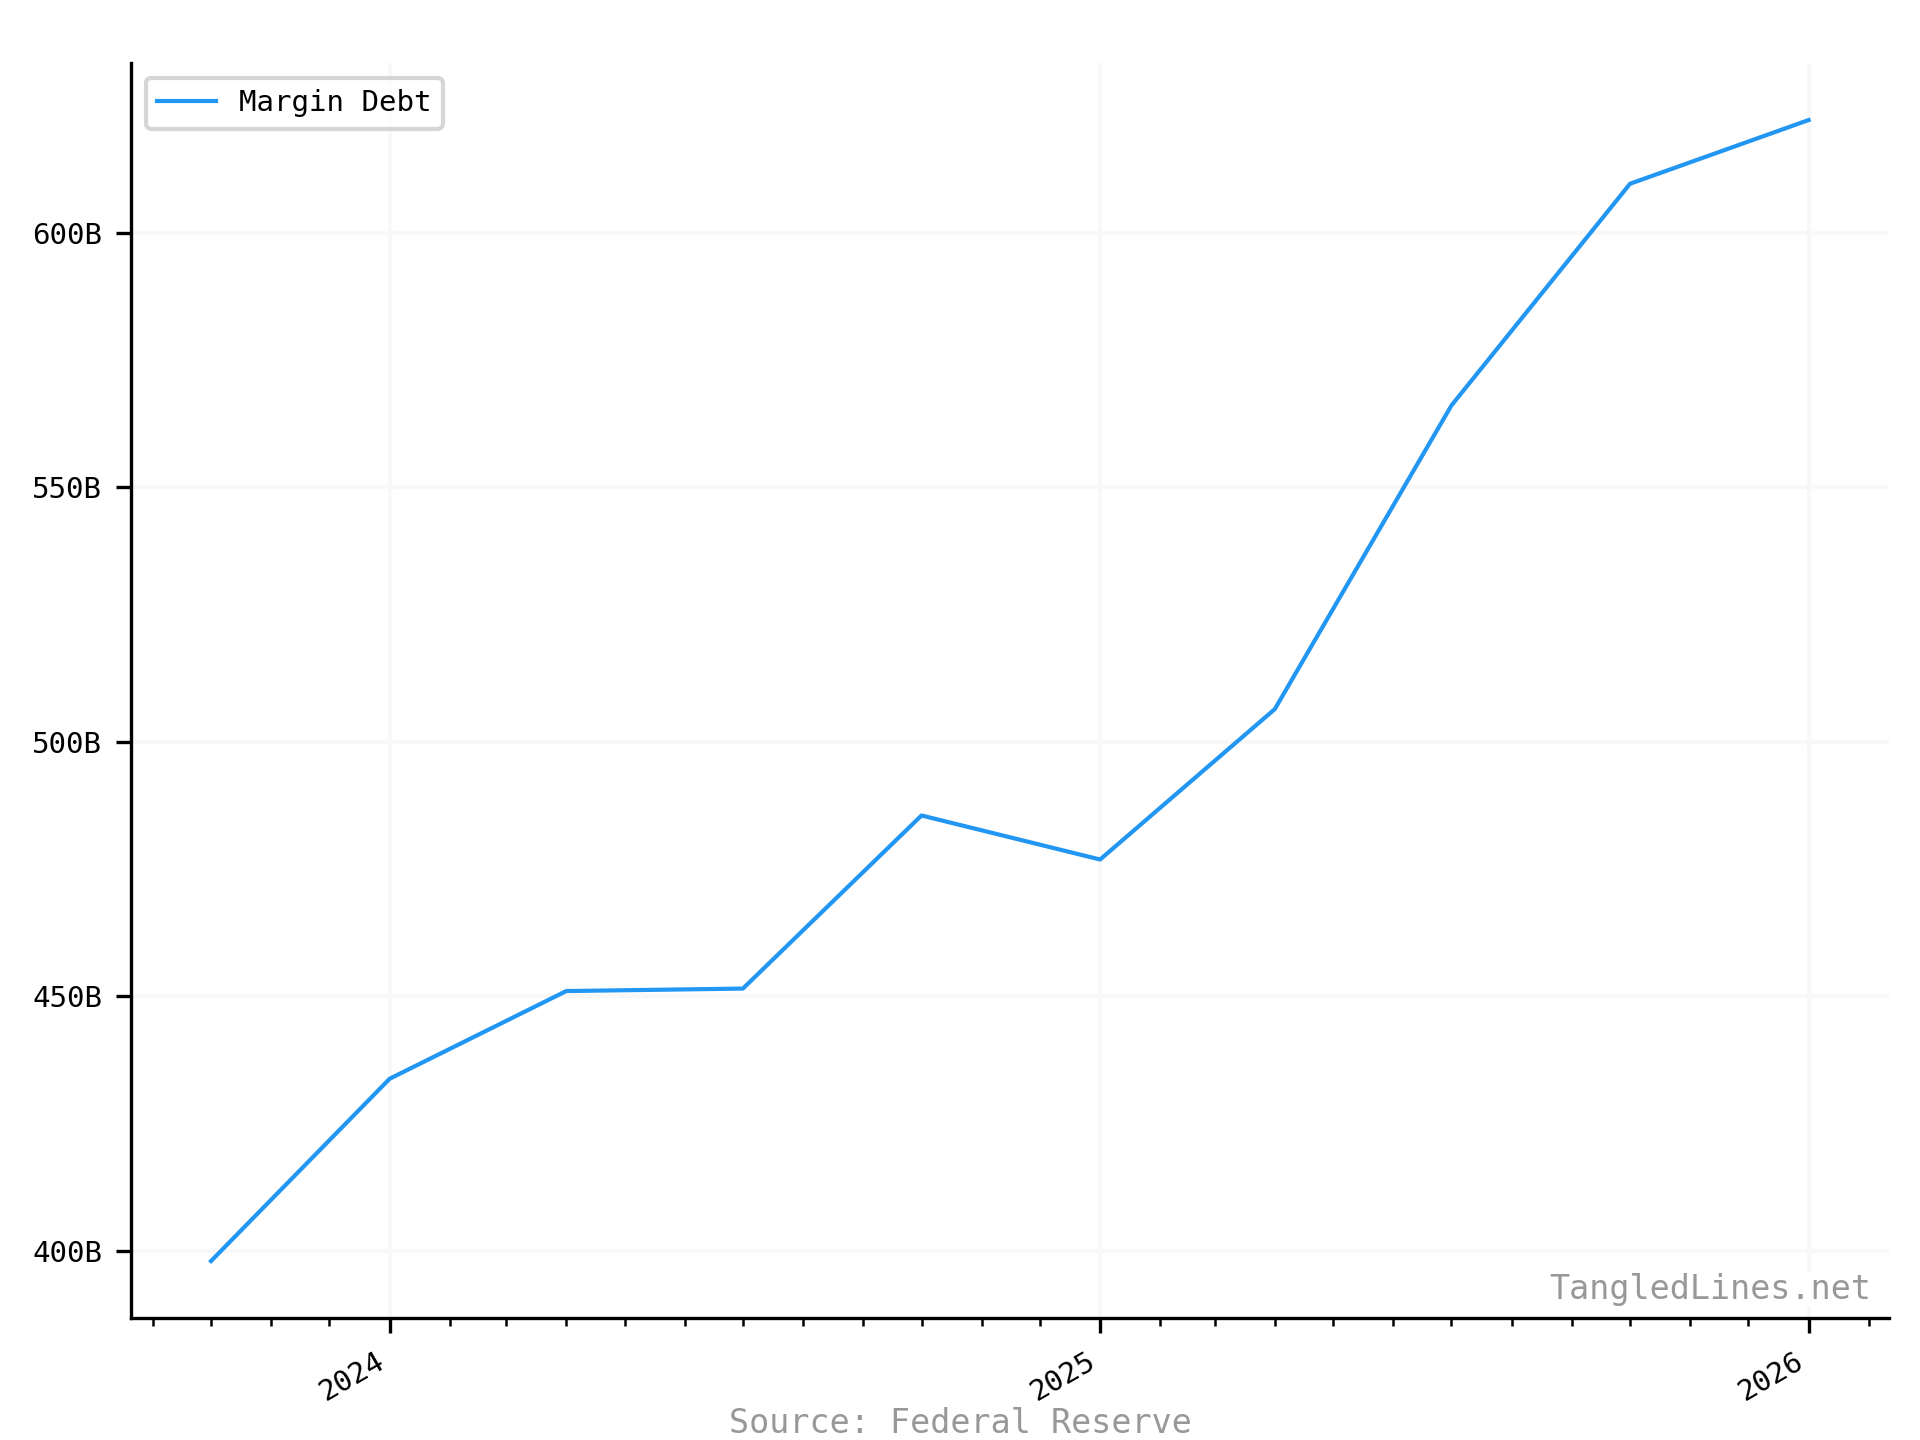
Lending
Commercial Bank Lending


| Series | Latest | Date |
|---|---|---|
| Commercial and Industrial Loans | 2.89T | 2026-07-15
Reported 2026-07-24 |
| Consumer Loans | 1.91T | 2026-07-15
Reported 2026-07-24 |
| Real Estate Loans | 5.81T | 2026-07-15
Reported 2026-07-24 |
| Other Loans | 3.30T | 2026-07-15
Reported 2026-07-24 |
Federal
Effective Fed Funds Rate

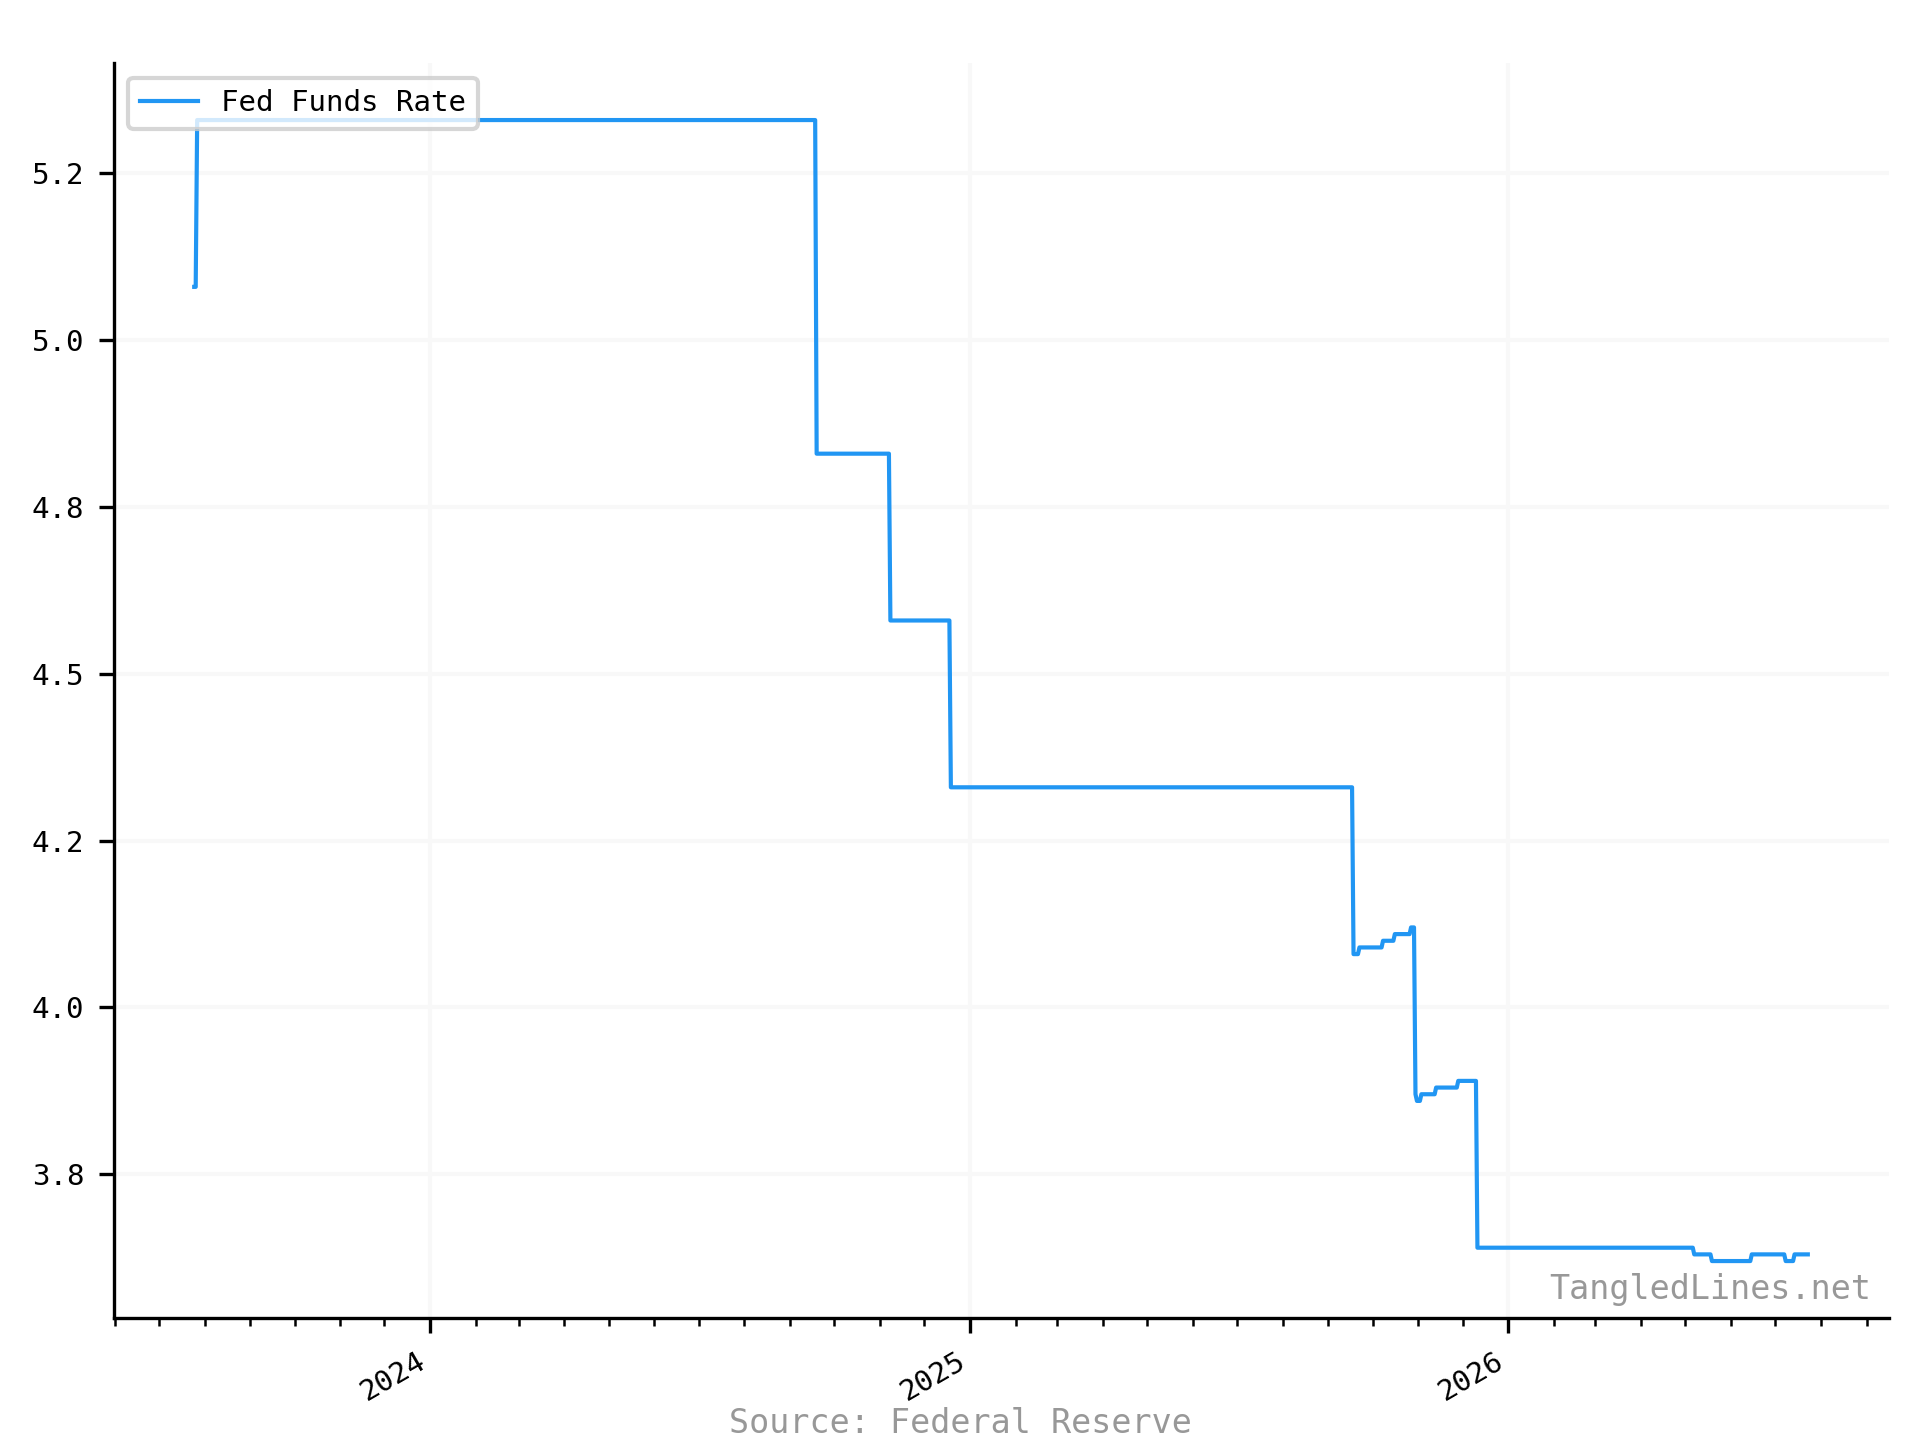
| Series | Latest | Date |
|---|---|---|
| Fed Funds Rate | 3.63 | 2026-07-23
Reported 2026-07-24 |
Reverse Repo
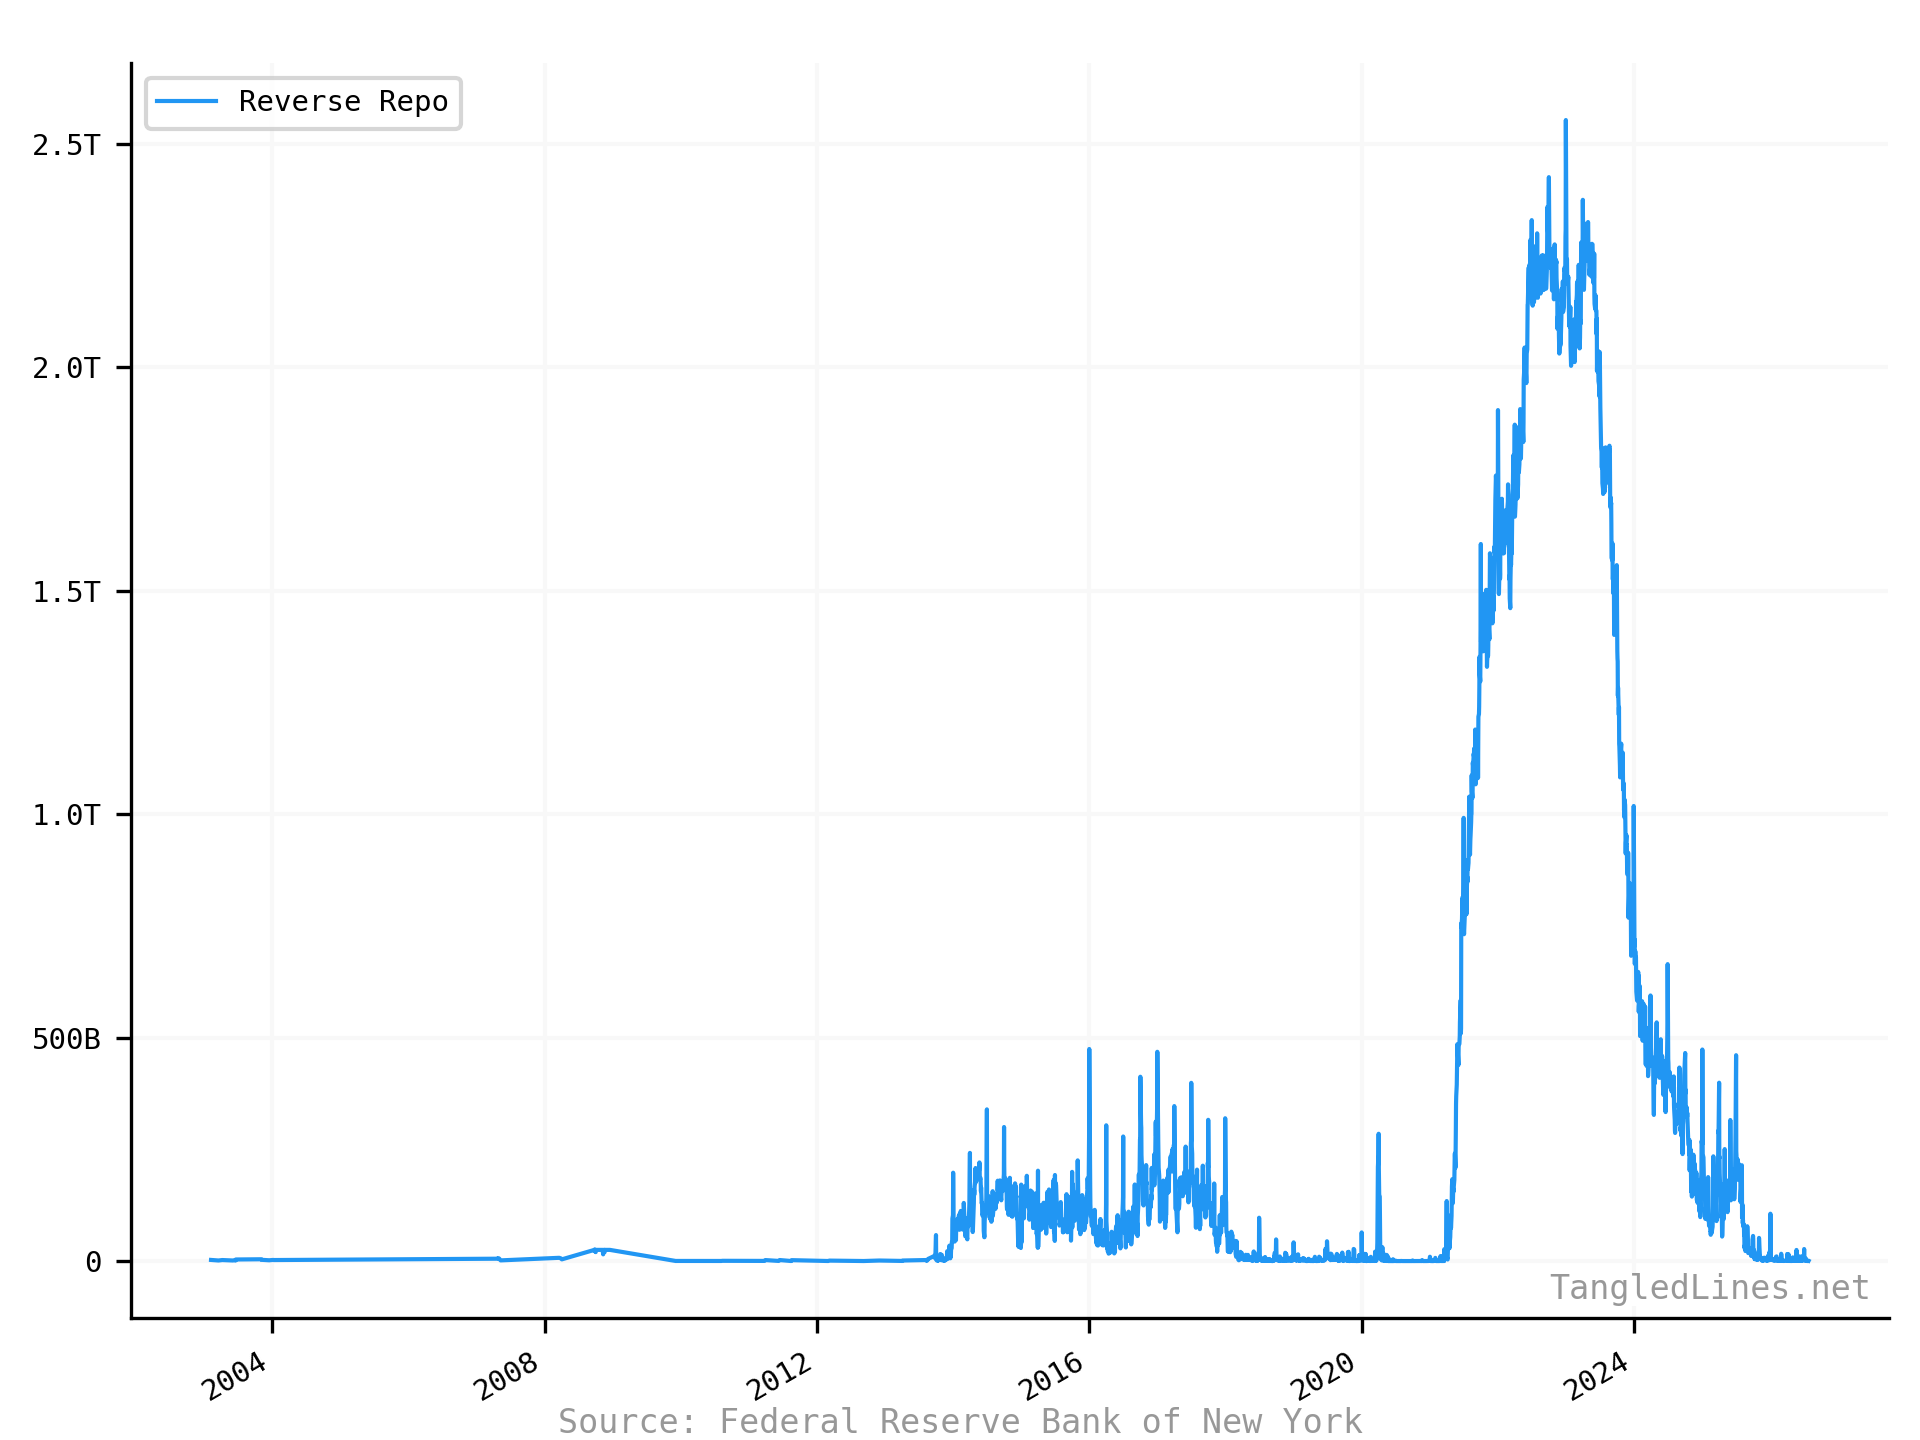

| Series | Latest | Date |
|---|---|---|
| Reverse Repo | 675M | 2026-07-24
Reported 2026-07-24 |
US Debt
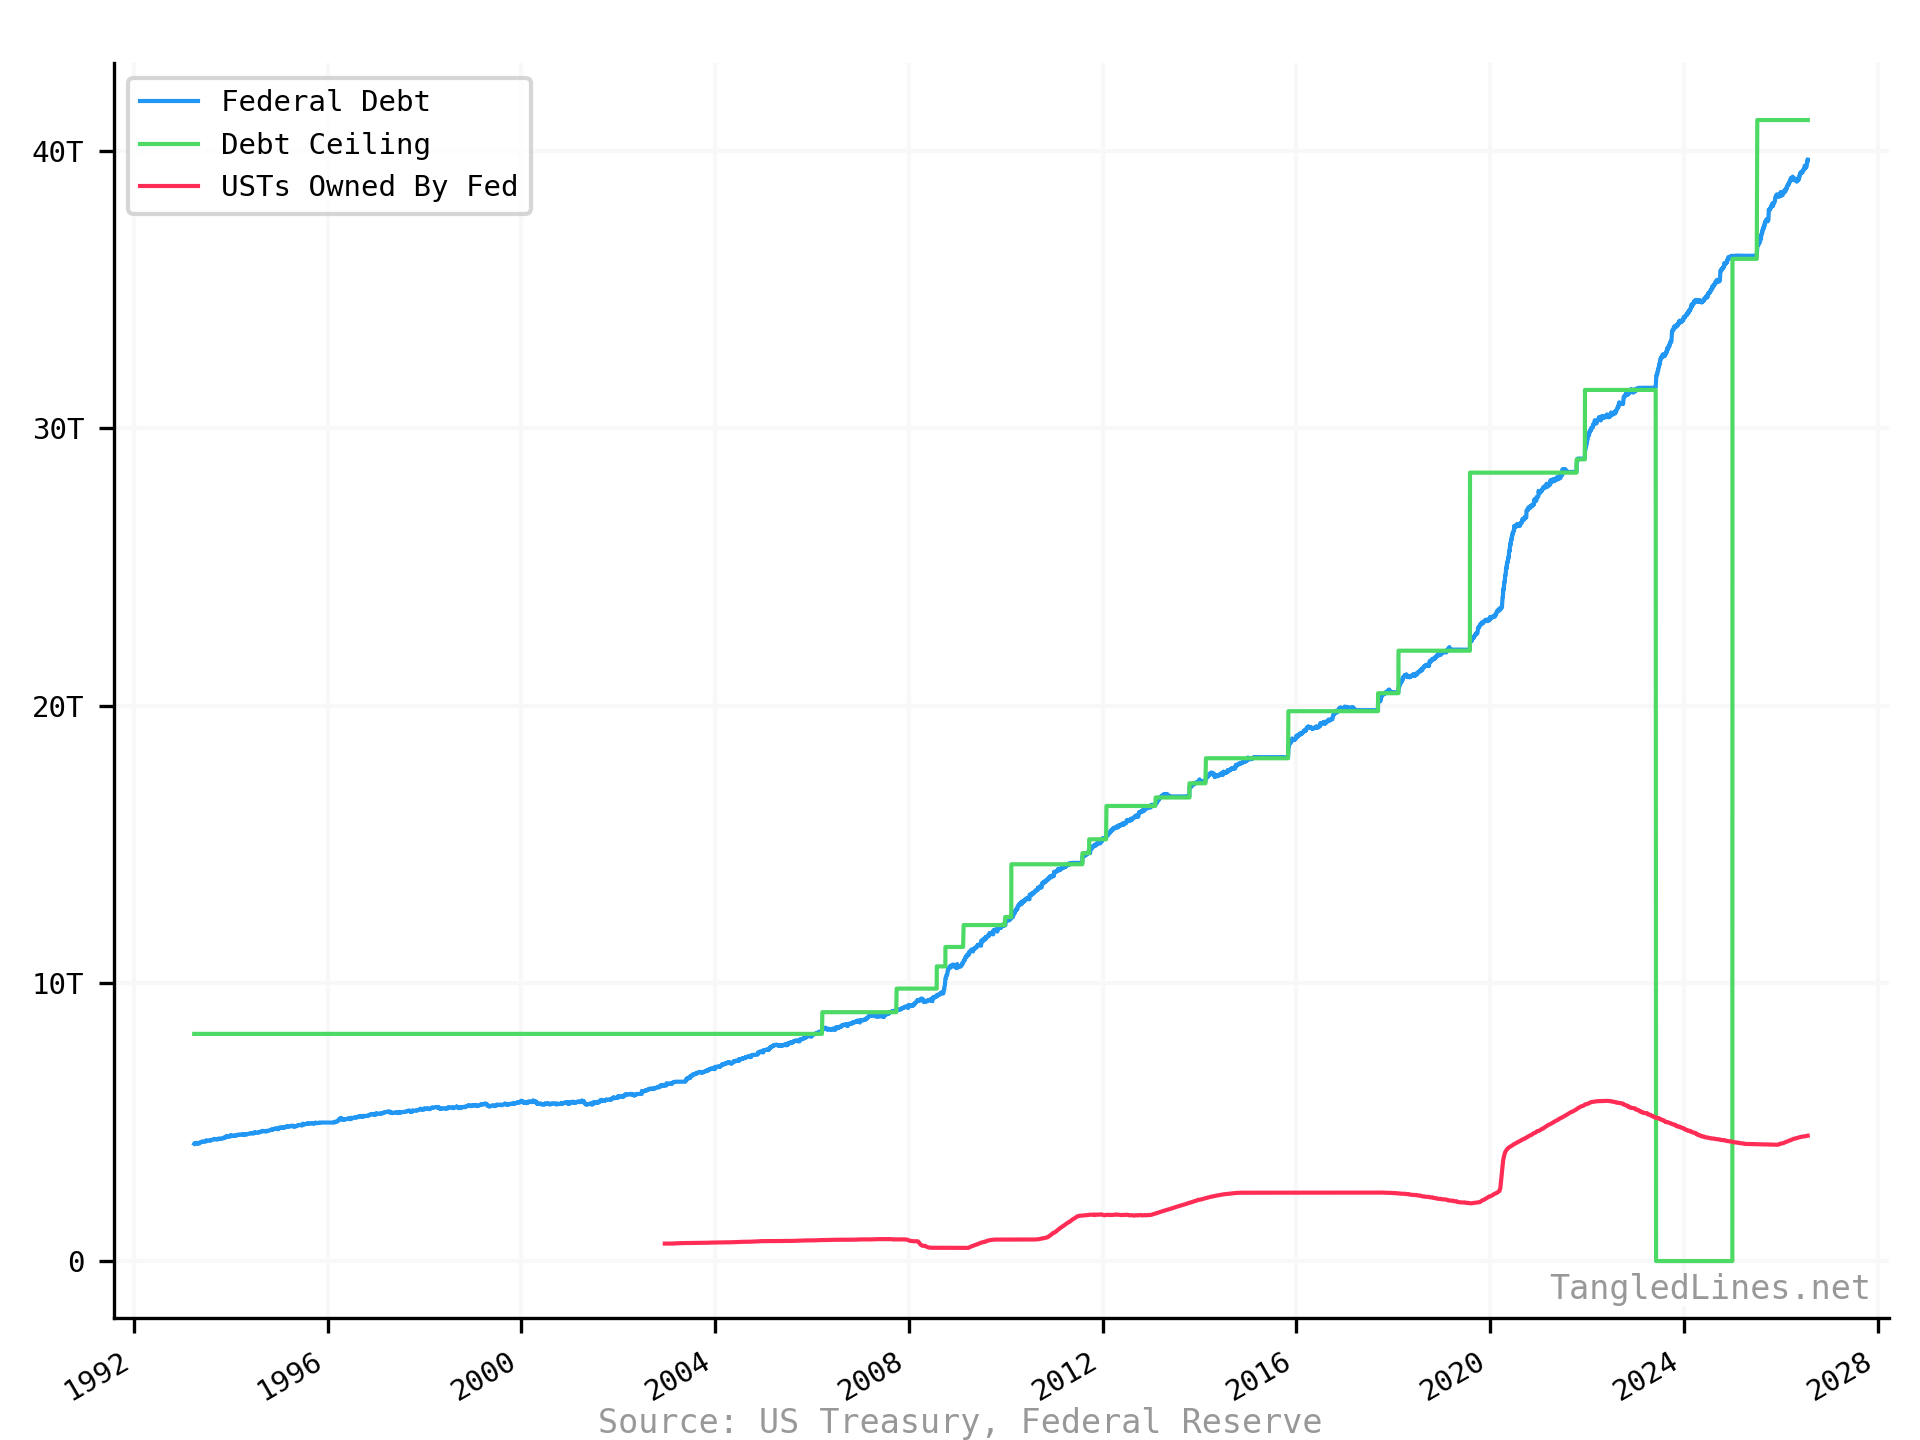
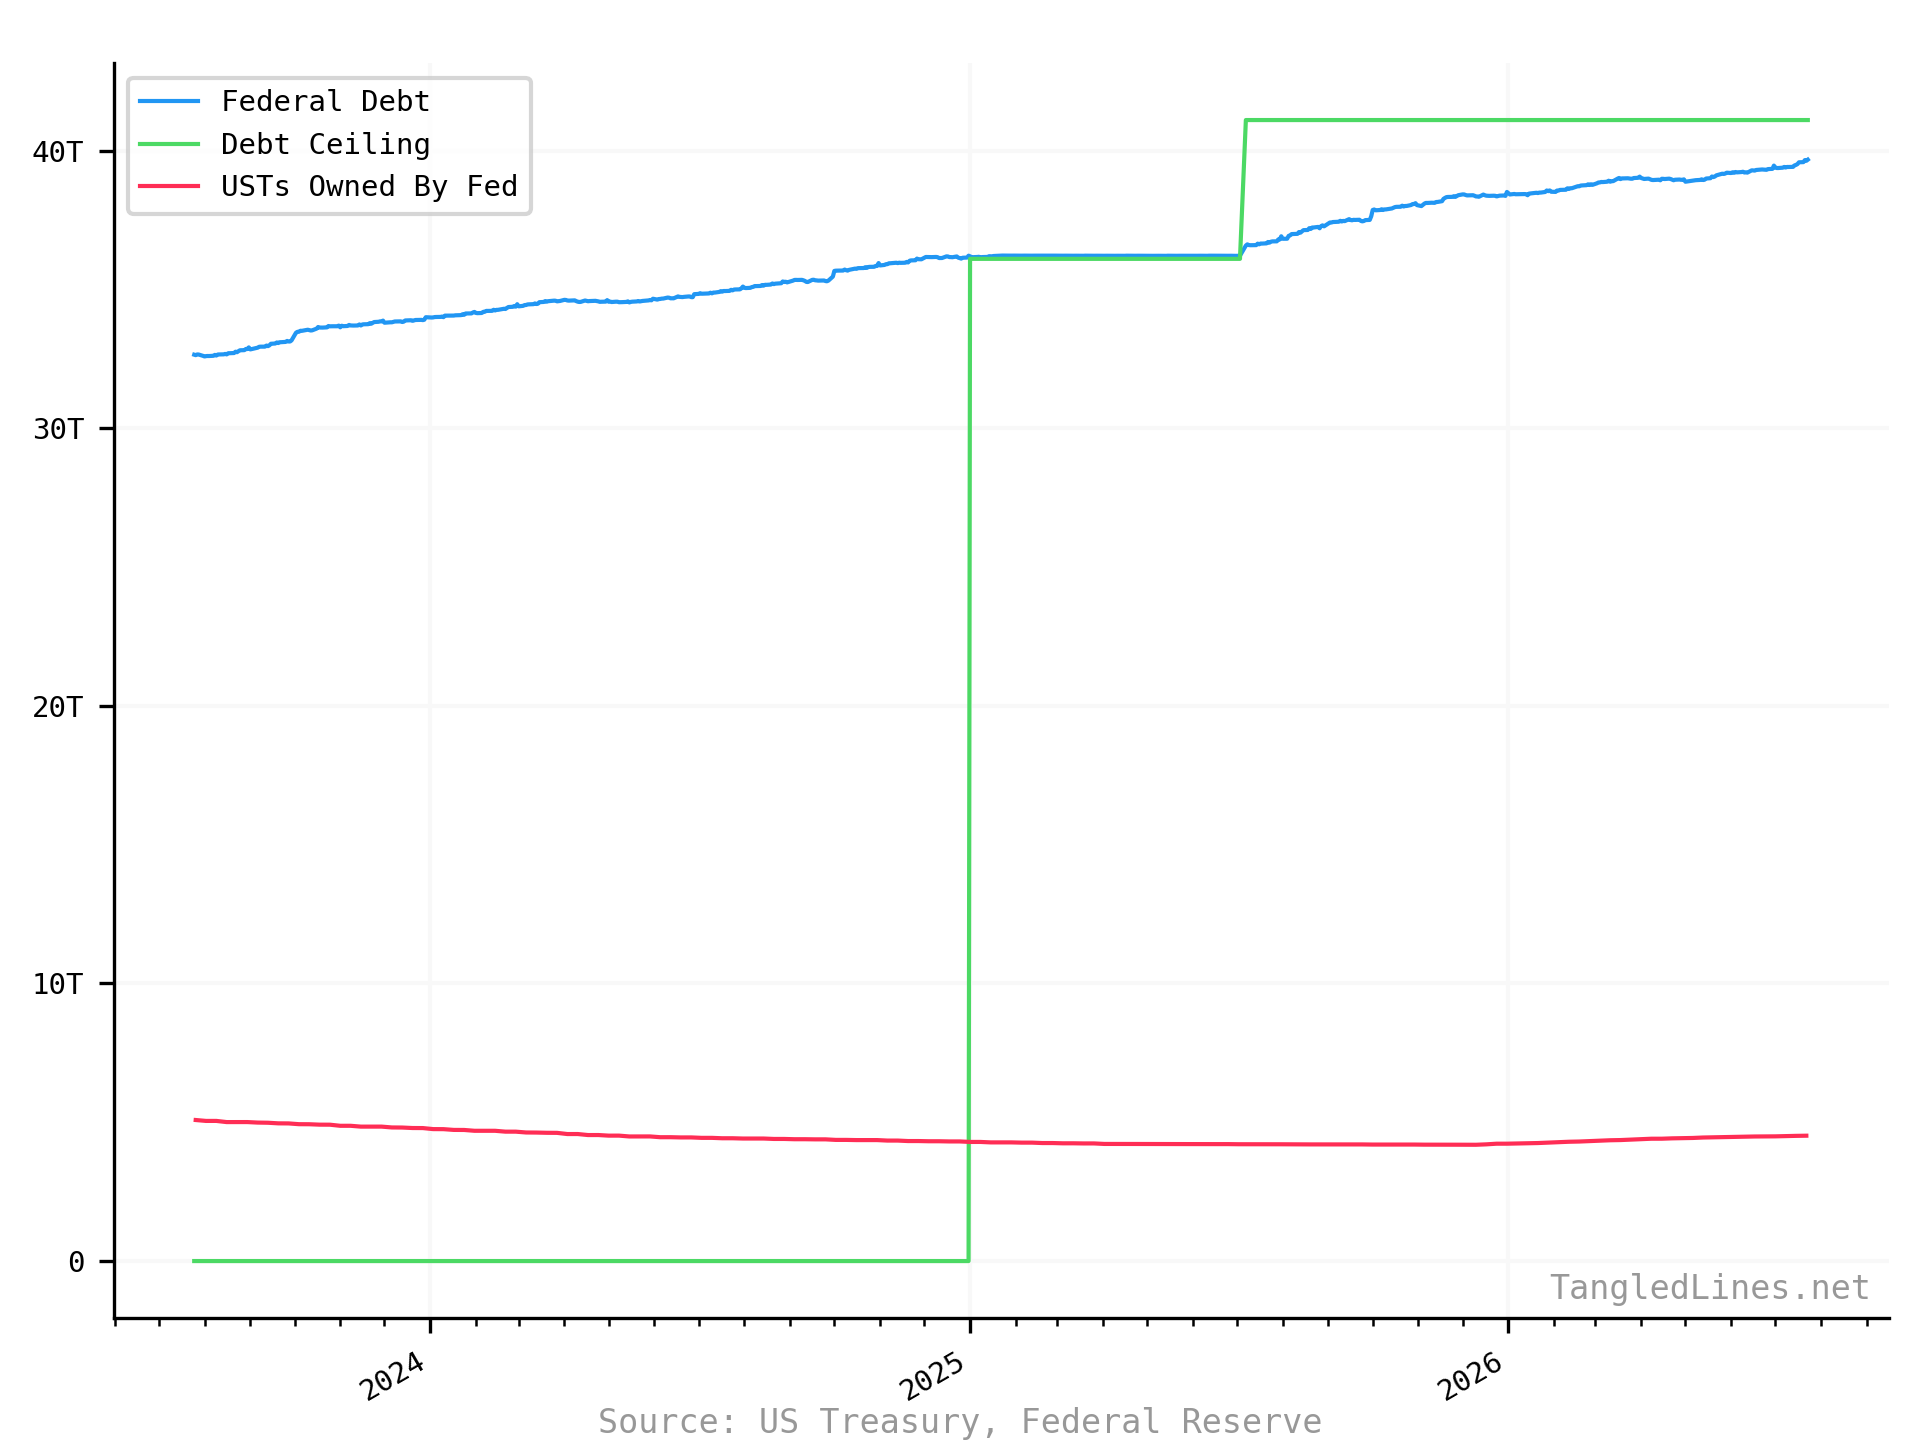
| Series | Latest | Date |
|---|---|---|
| Federal Debt | 40T | 2026-07-23
Reported 2026-07-24 |
| Debt Ceiling | 41T | 2026-07-23
Reported 2026-07-24 |
| USTs Owned By Fed | 4.52T | 2026-07-22
Reported 2026-07-23 |
Treasury General Account
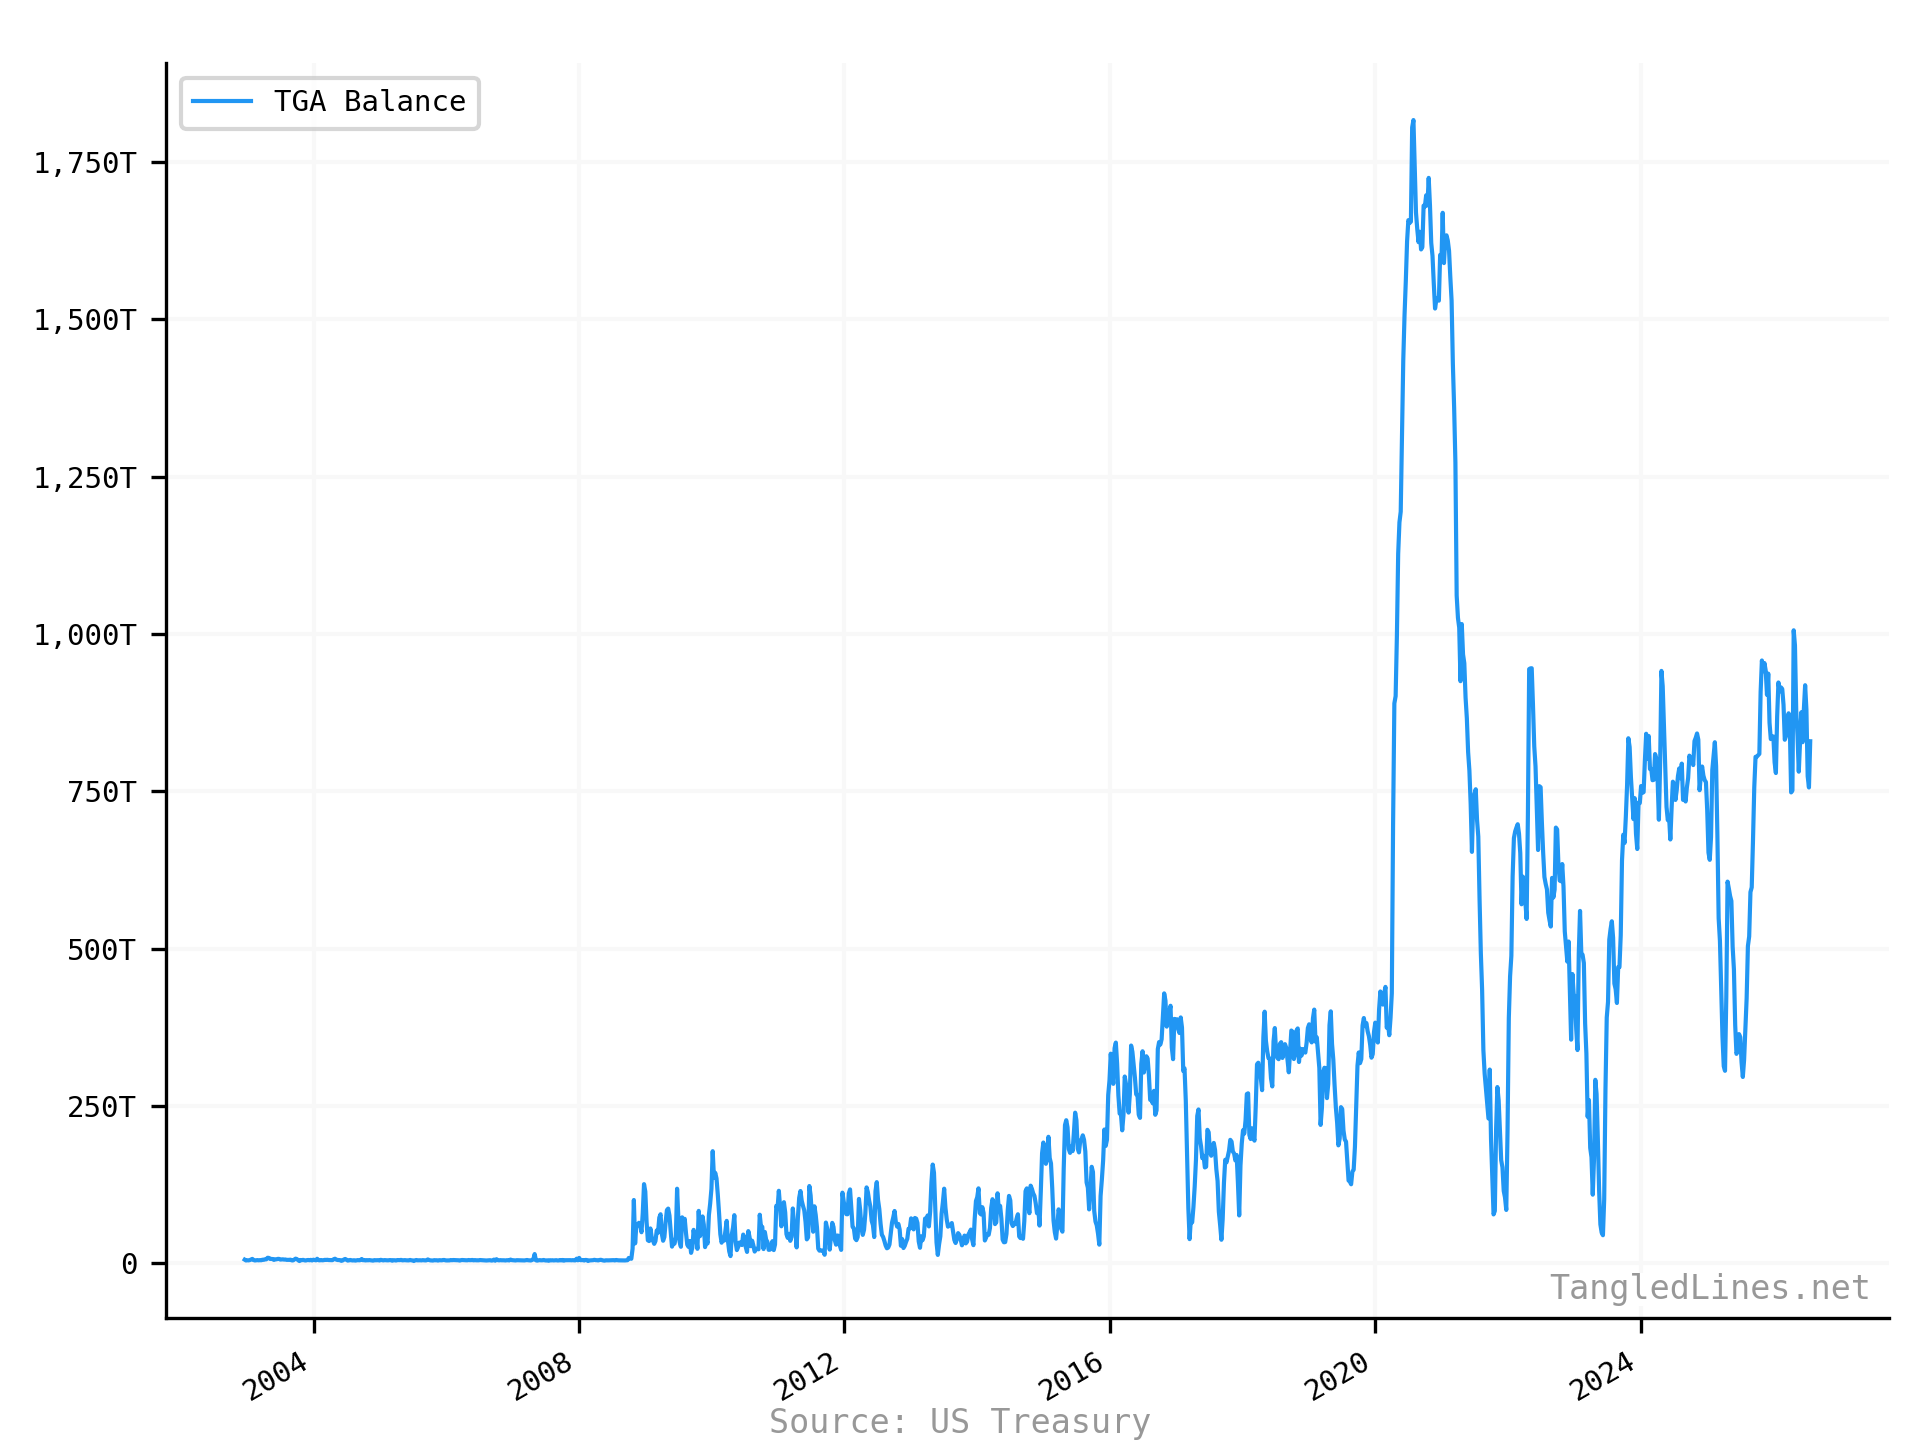
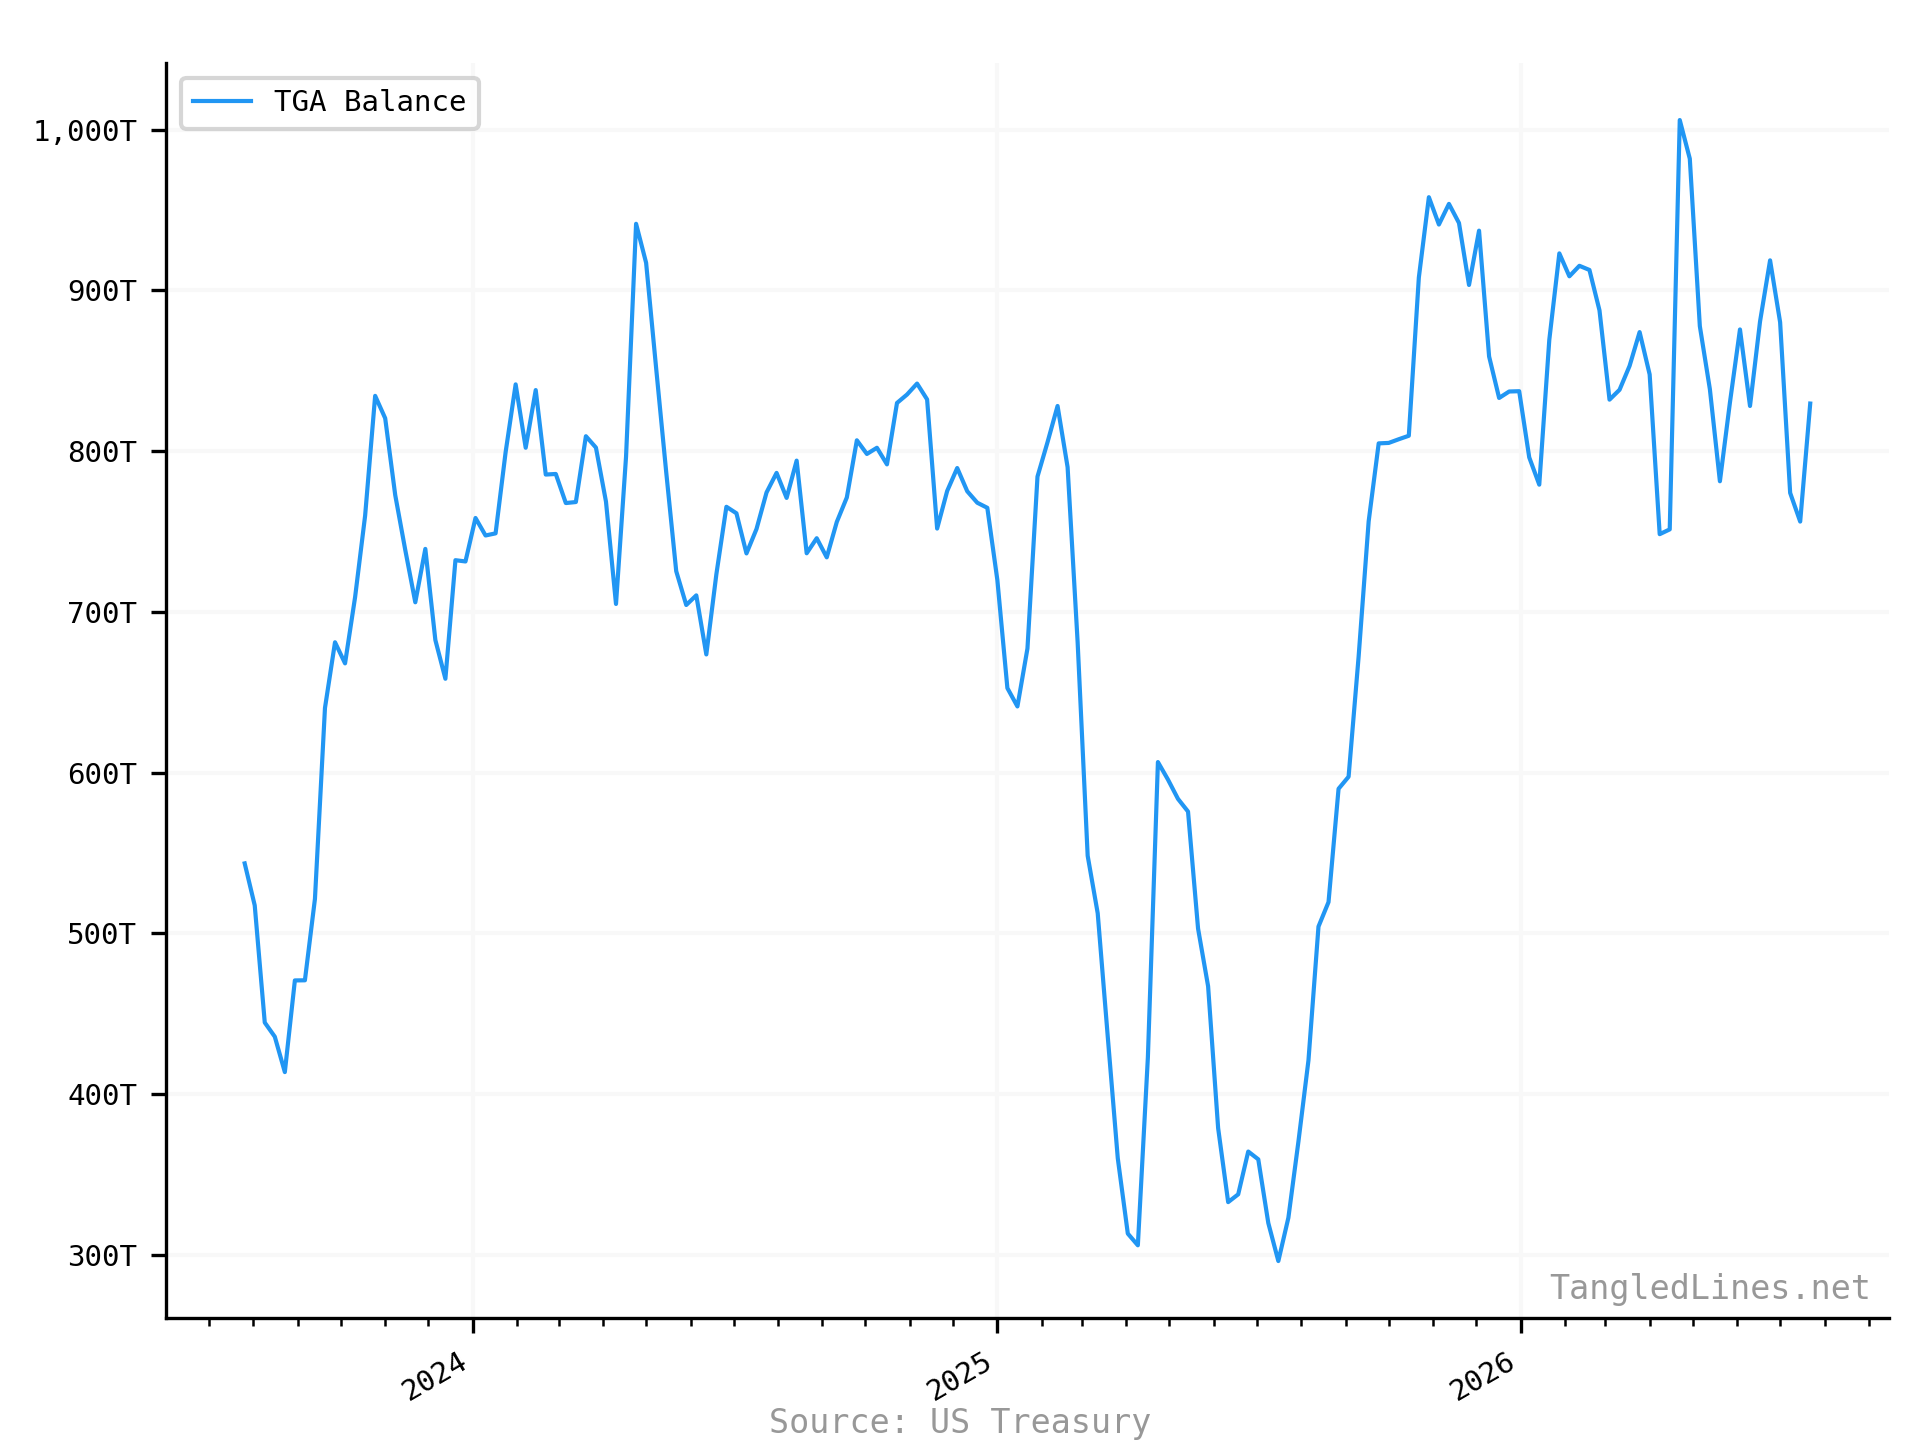
| Series | Latest | Date |
|---|---|---|
| TGA Balance | 830T | 2026-07-22
Reported 2026-07-23 |
Macro
Household Checkable Deposits and Currency


| Series | Latest | Date |
|---|---|---|
| Household Checkable Deposits and Currency | 5.62T | 2026-01-01
Reported 2026-06-12 |
Personal Savings
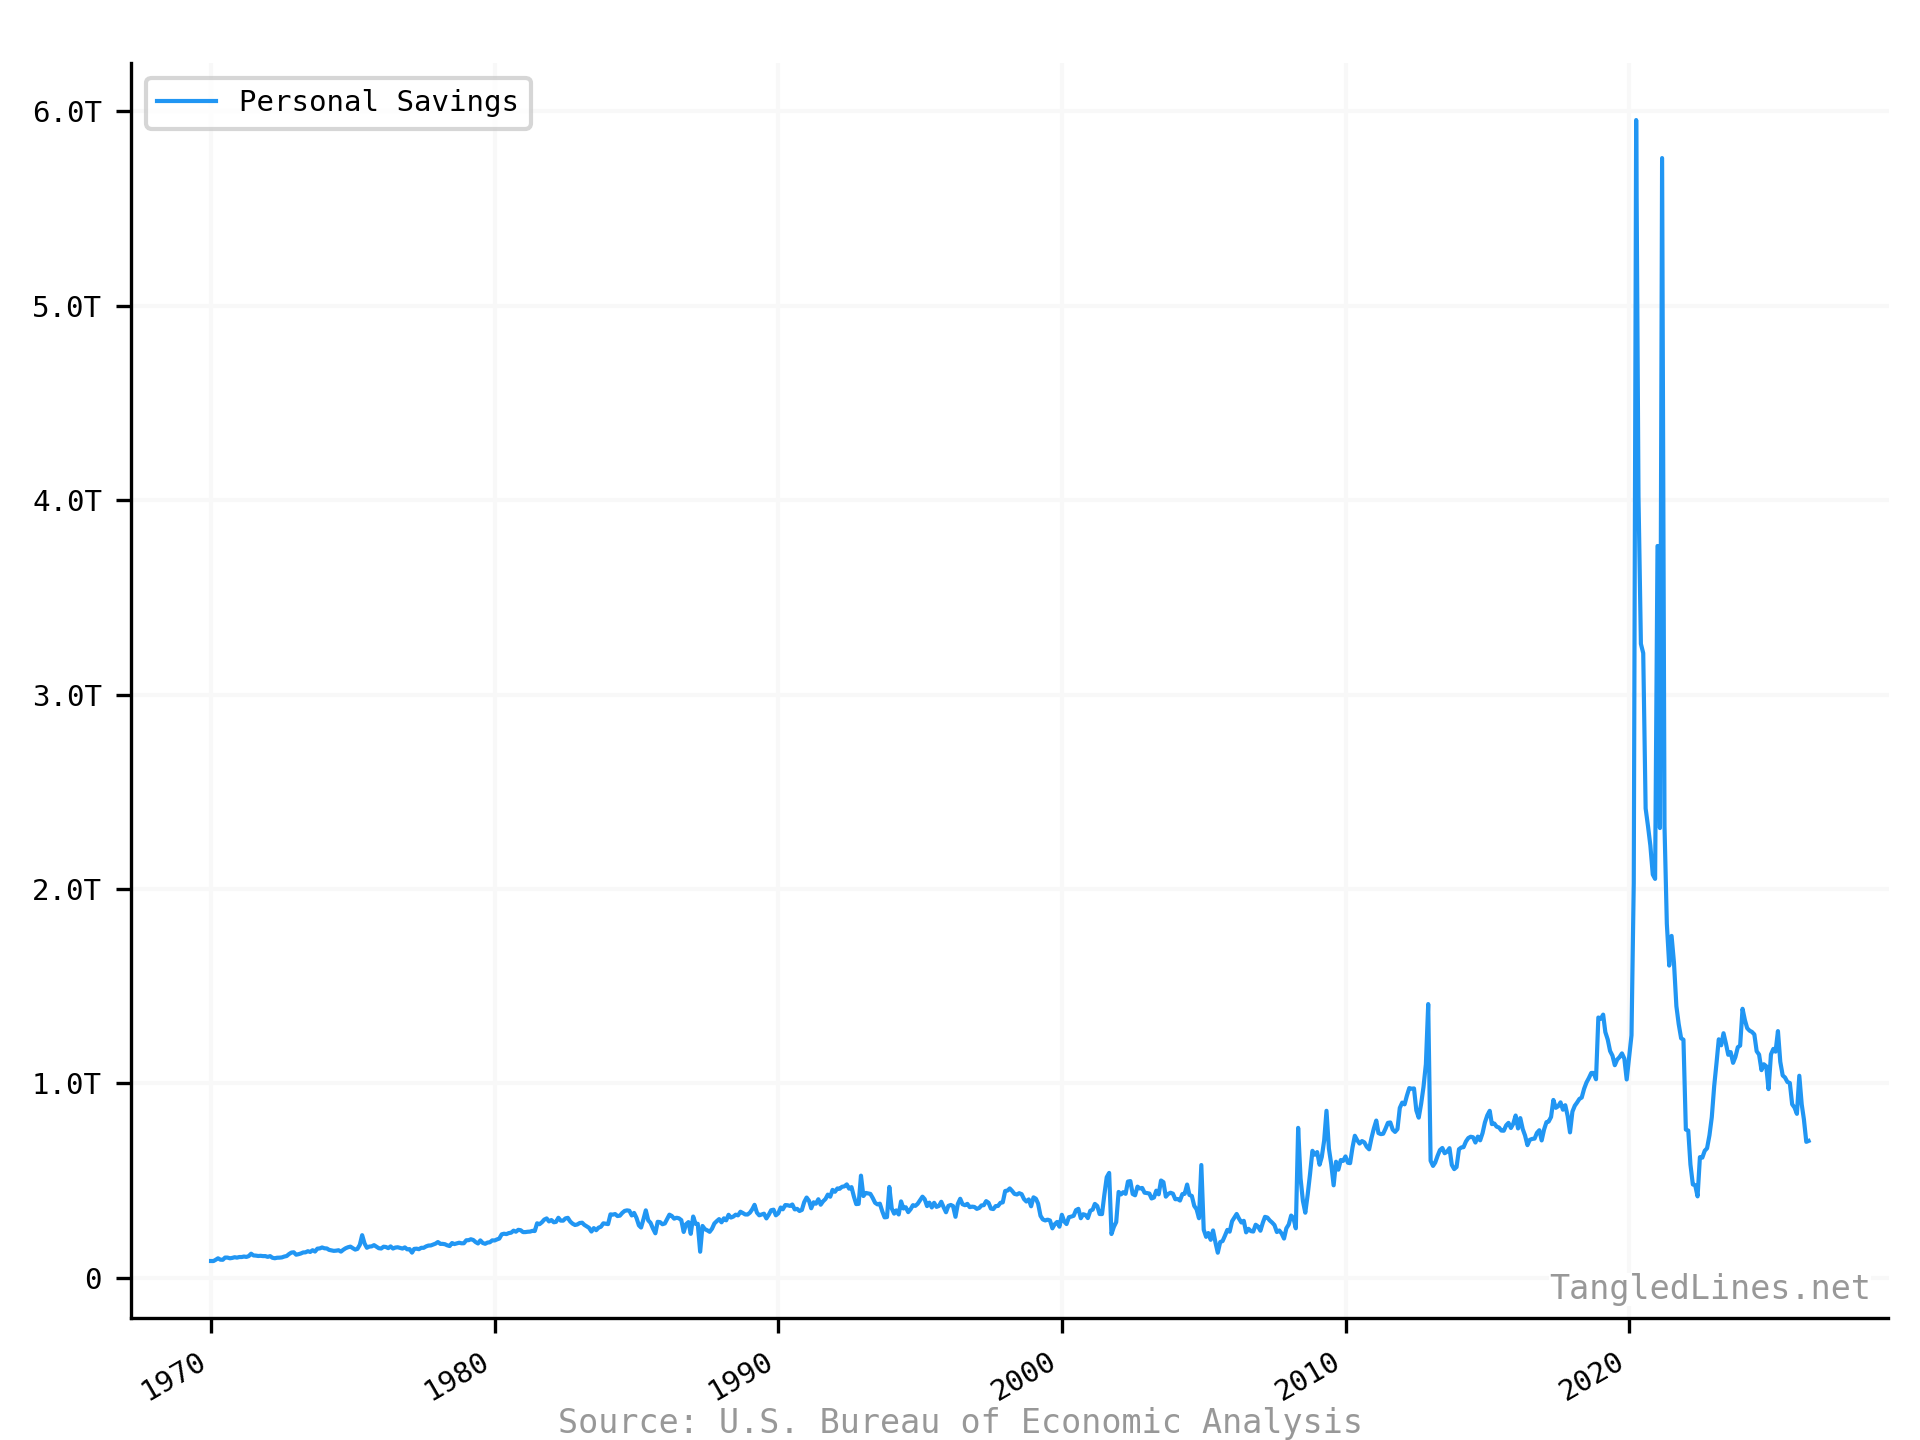
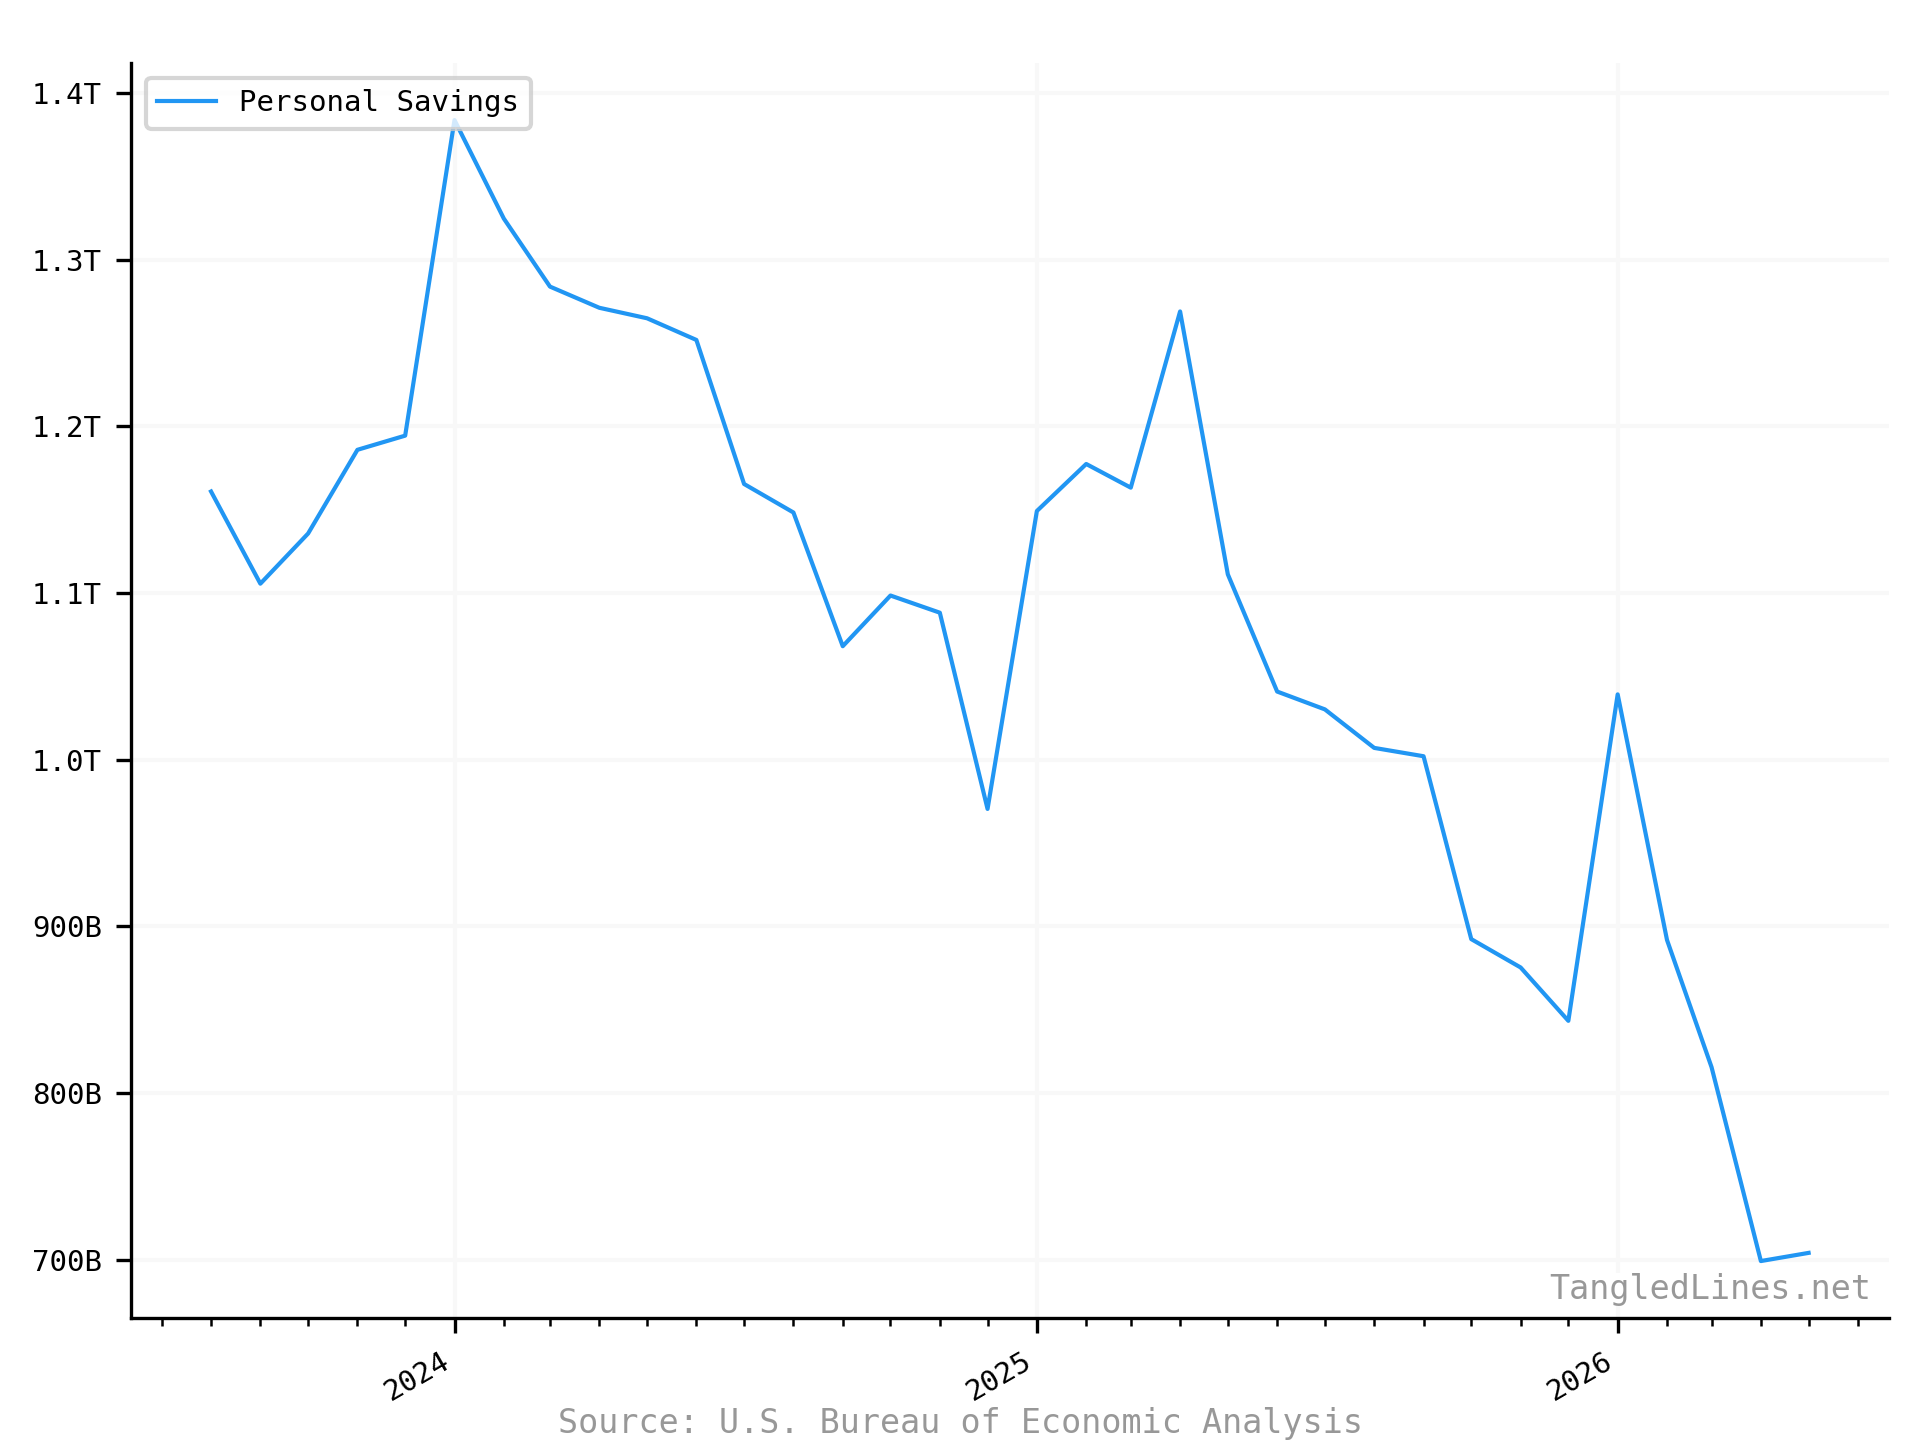
| Series | Latest | Date |
|---|---|---|
| Personal Savings | 704B | 2026-05-01
Reported 2026-06-25 |
Retail Sales
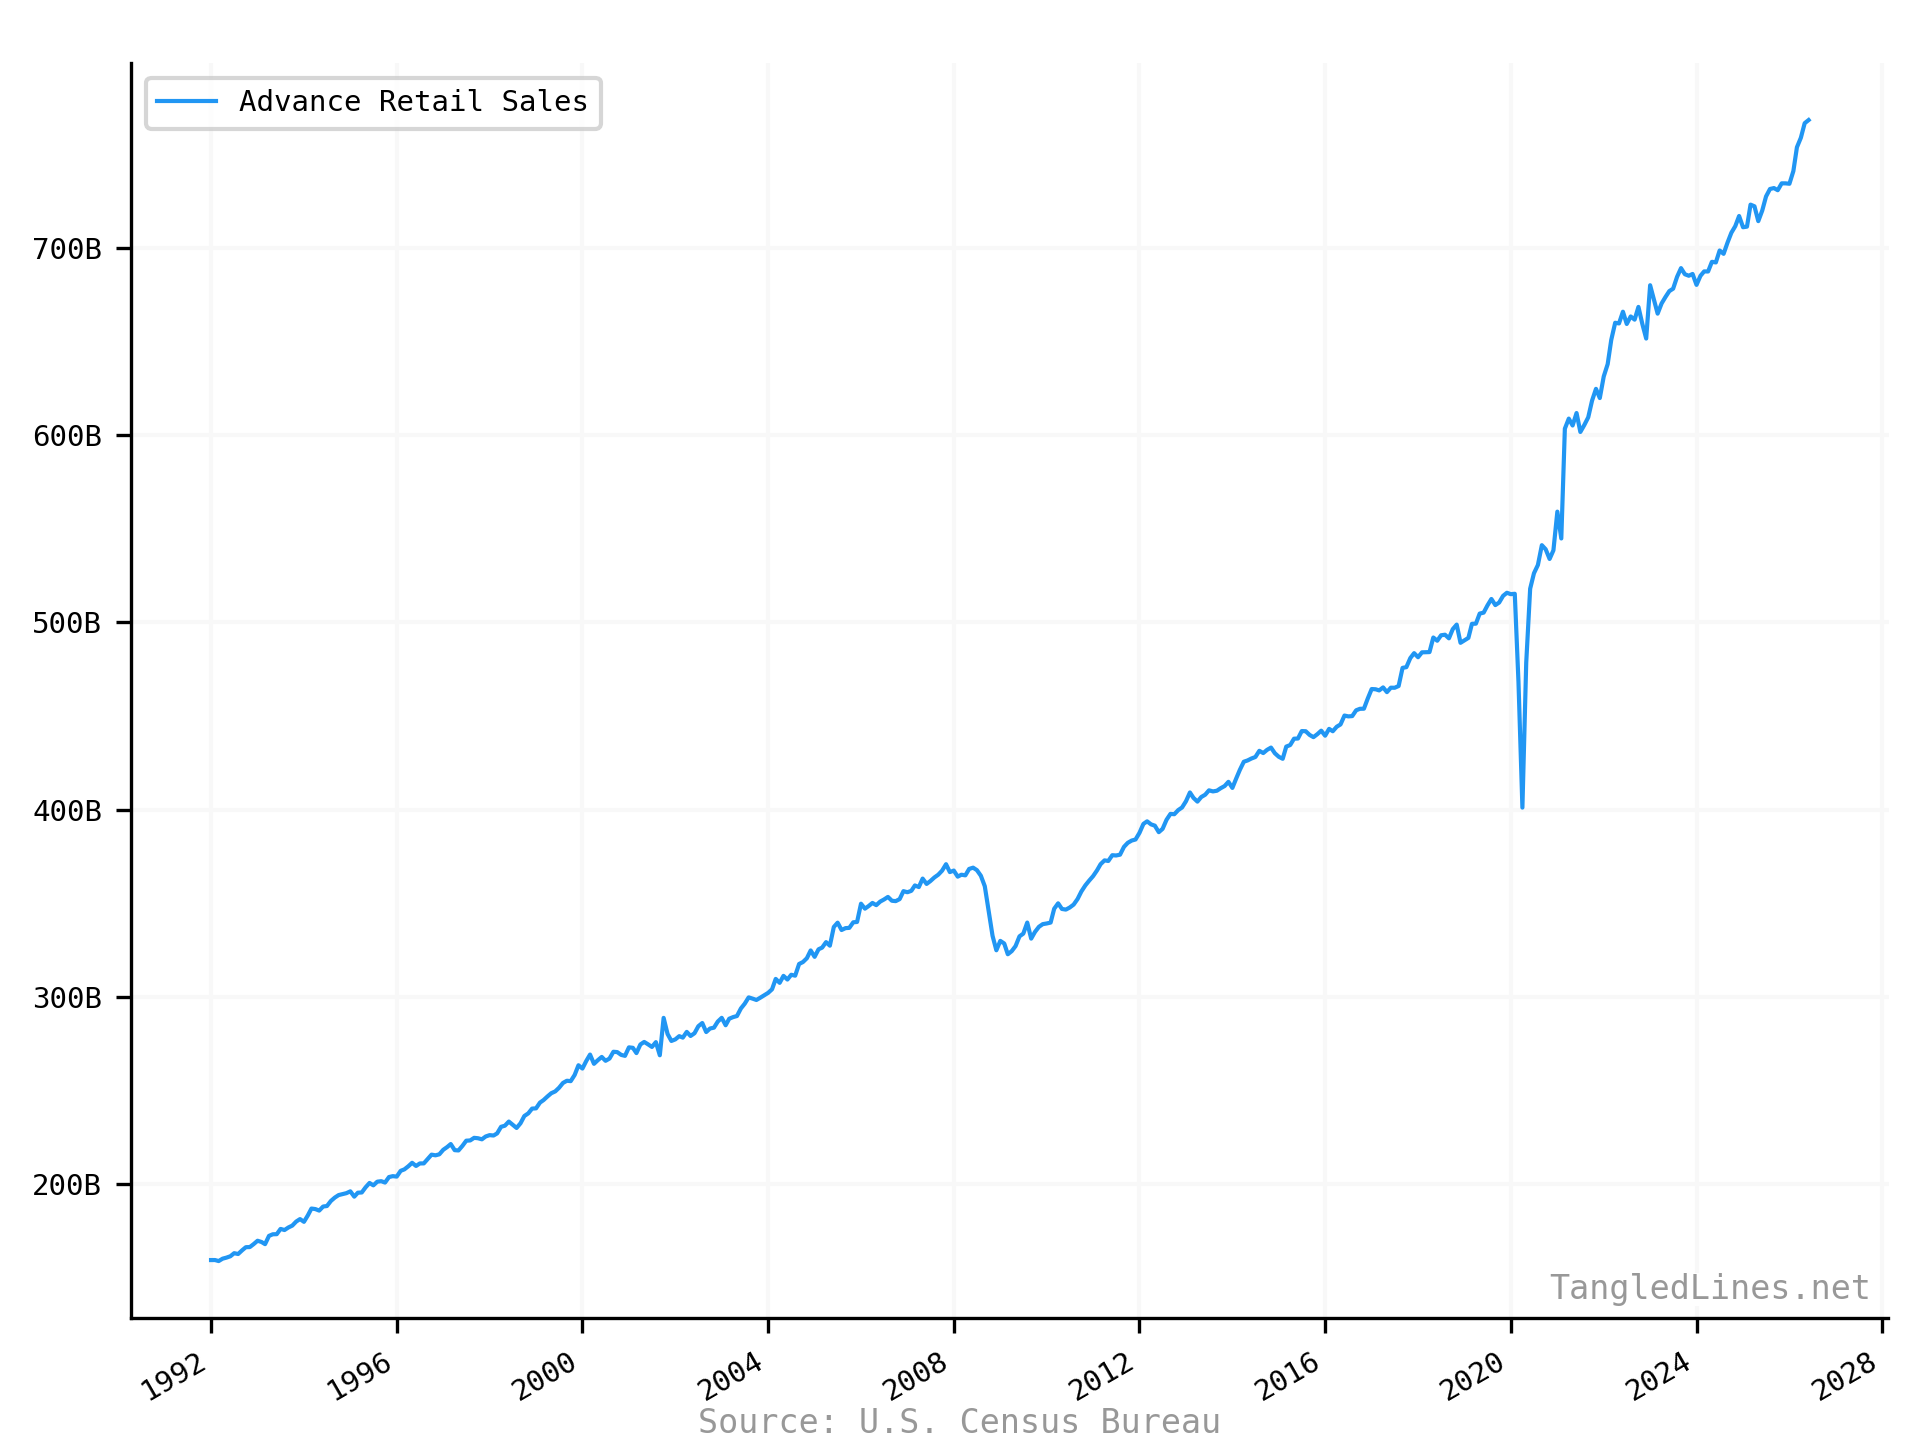
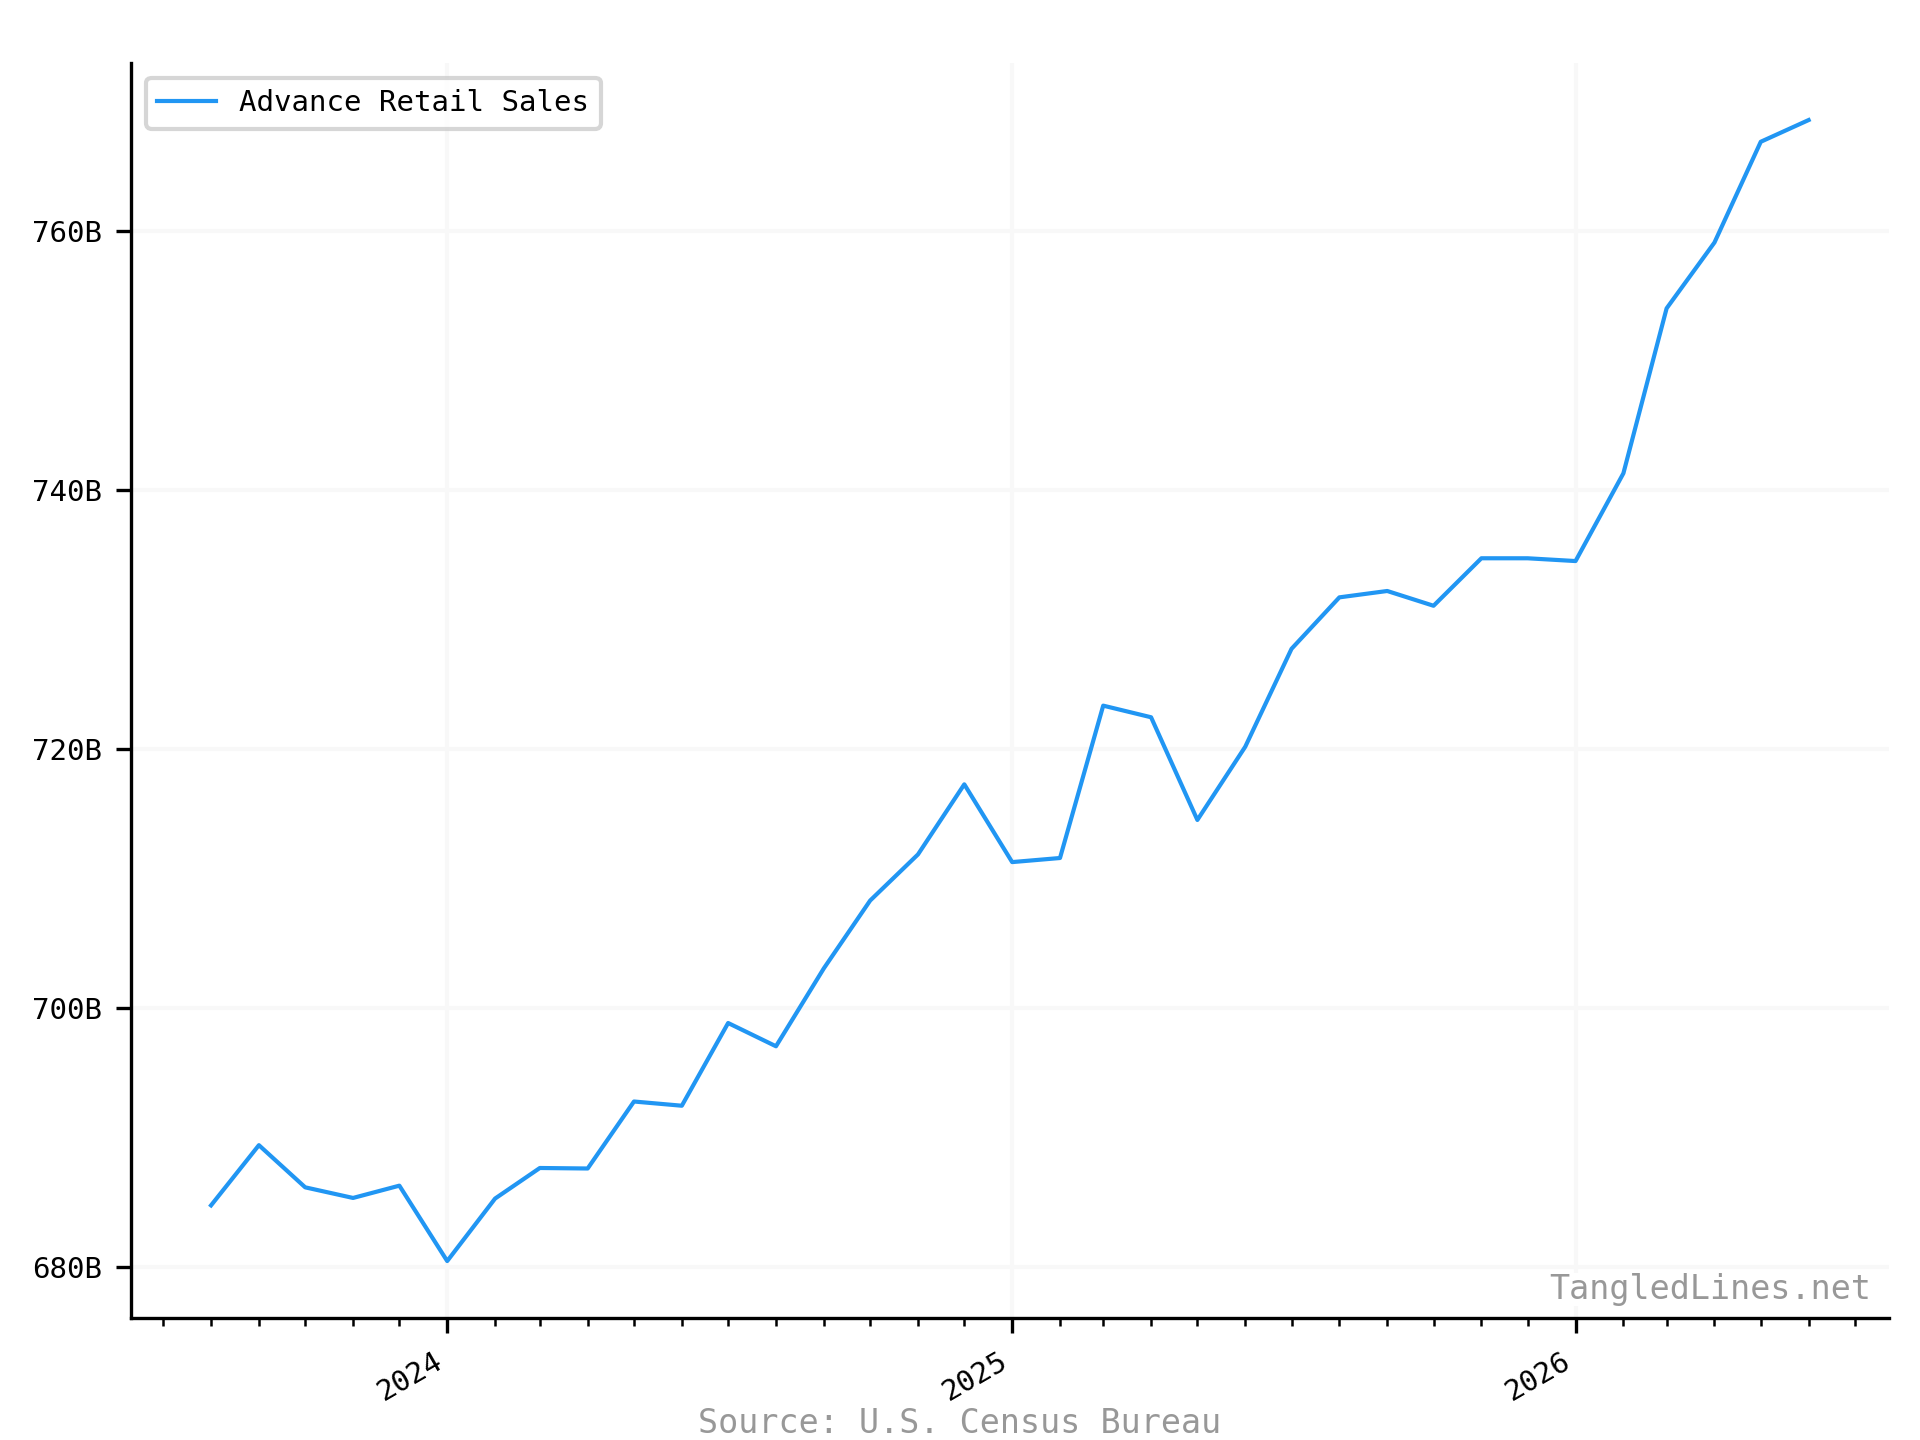
| Series | Latest | Date |
|---|---|---|
| Advance Retail Sales | 769B | 2026-06-01
Reported 2026-07-16 |
Tonnage
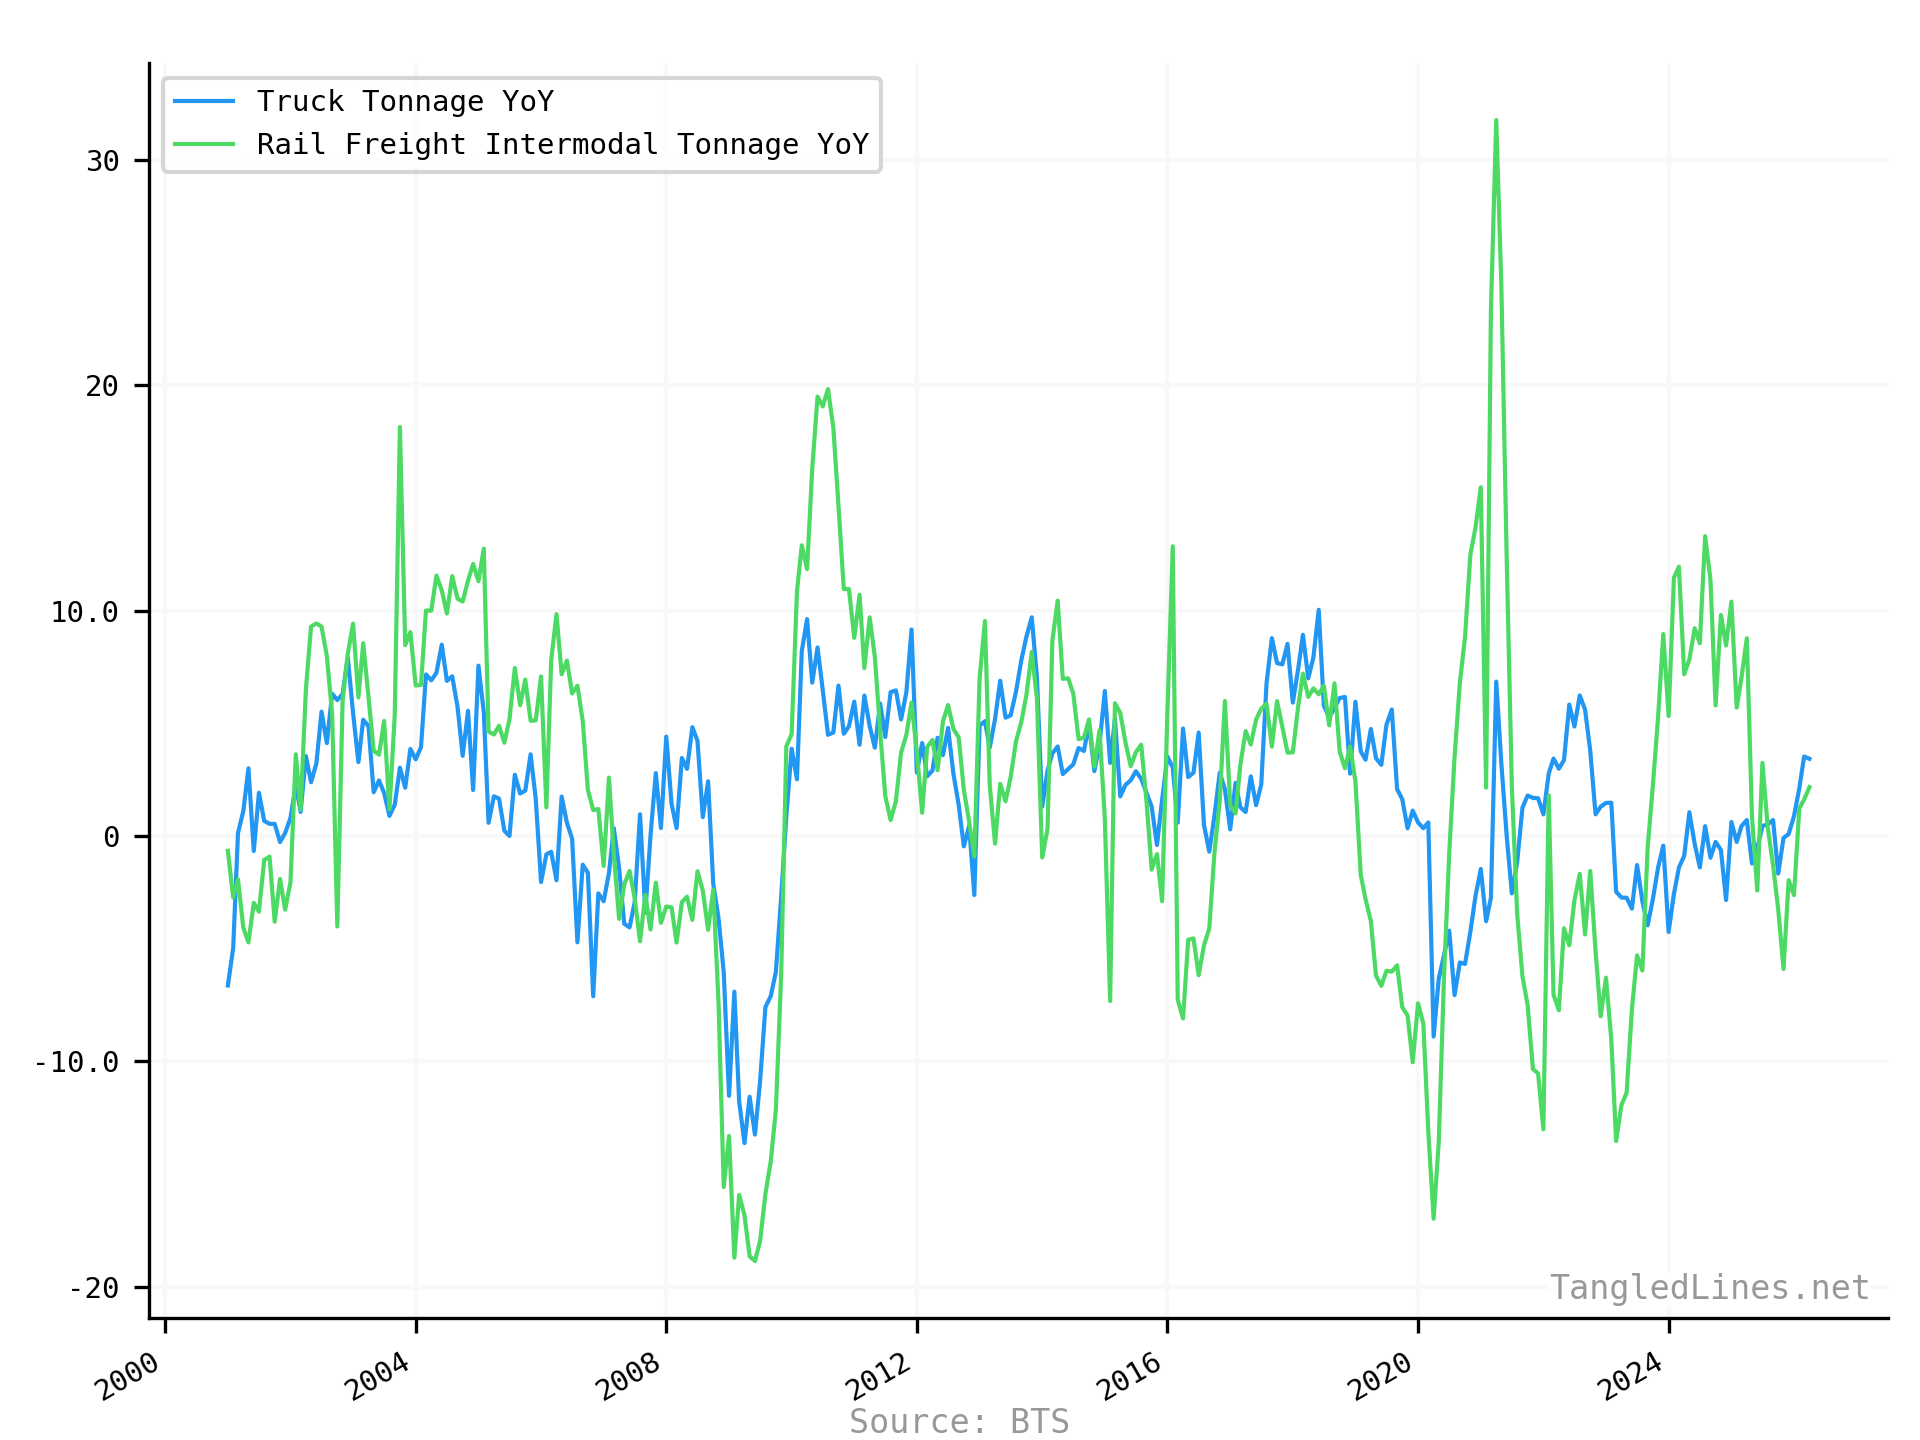
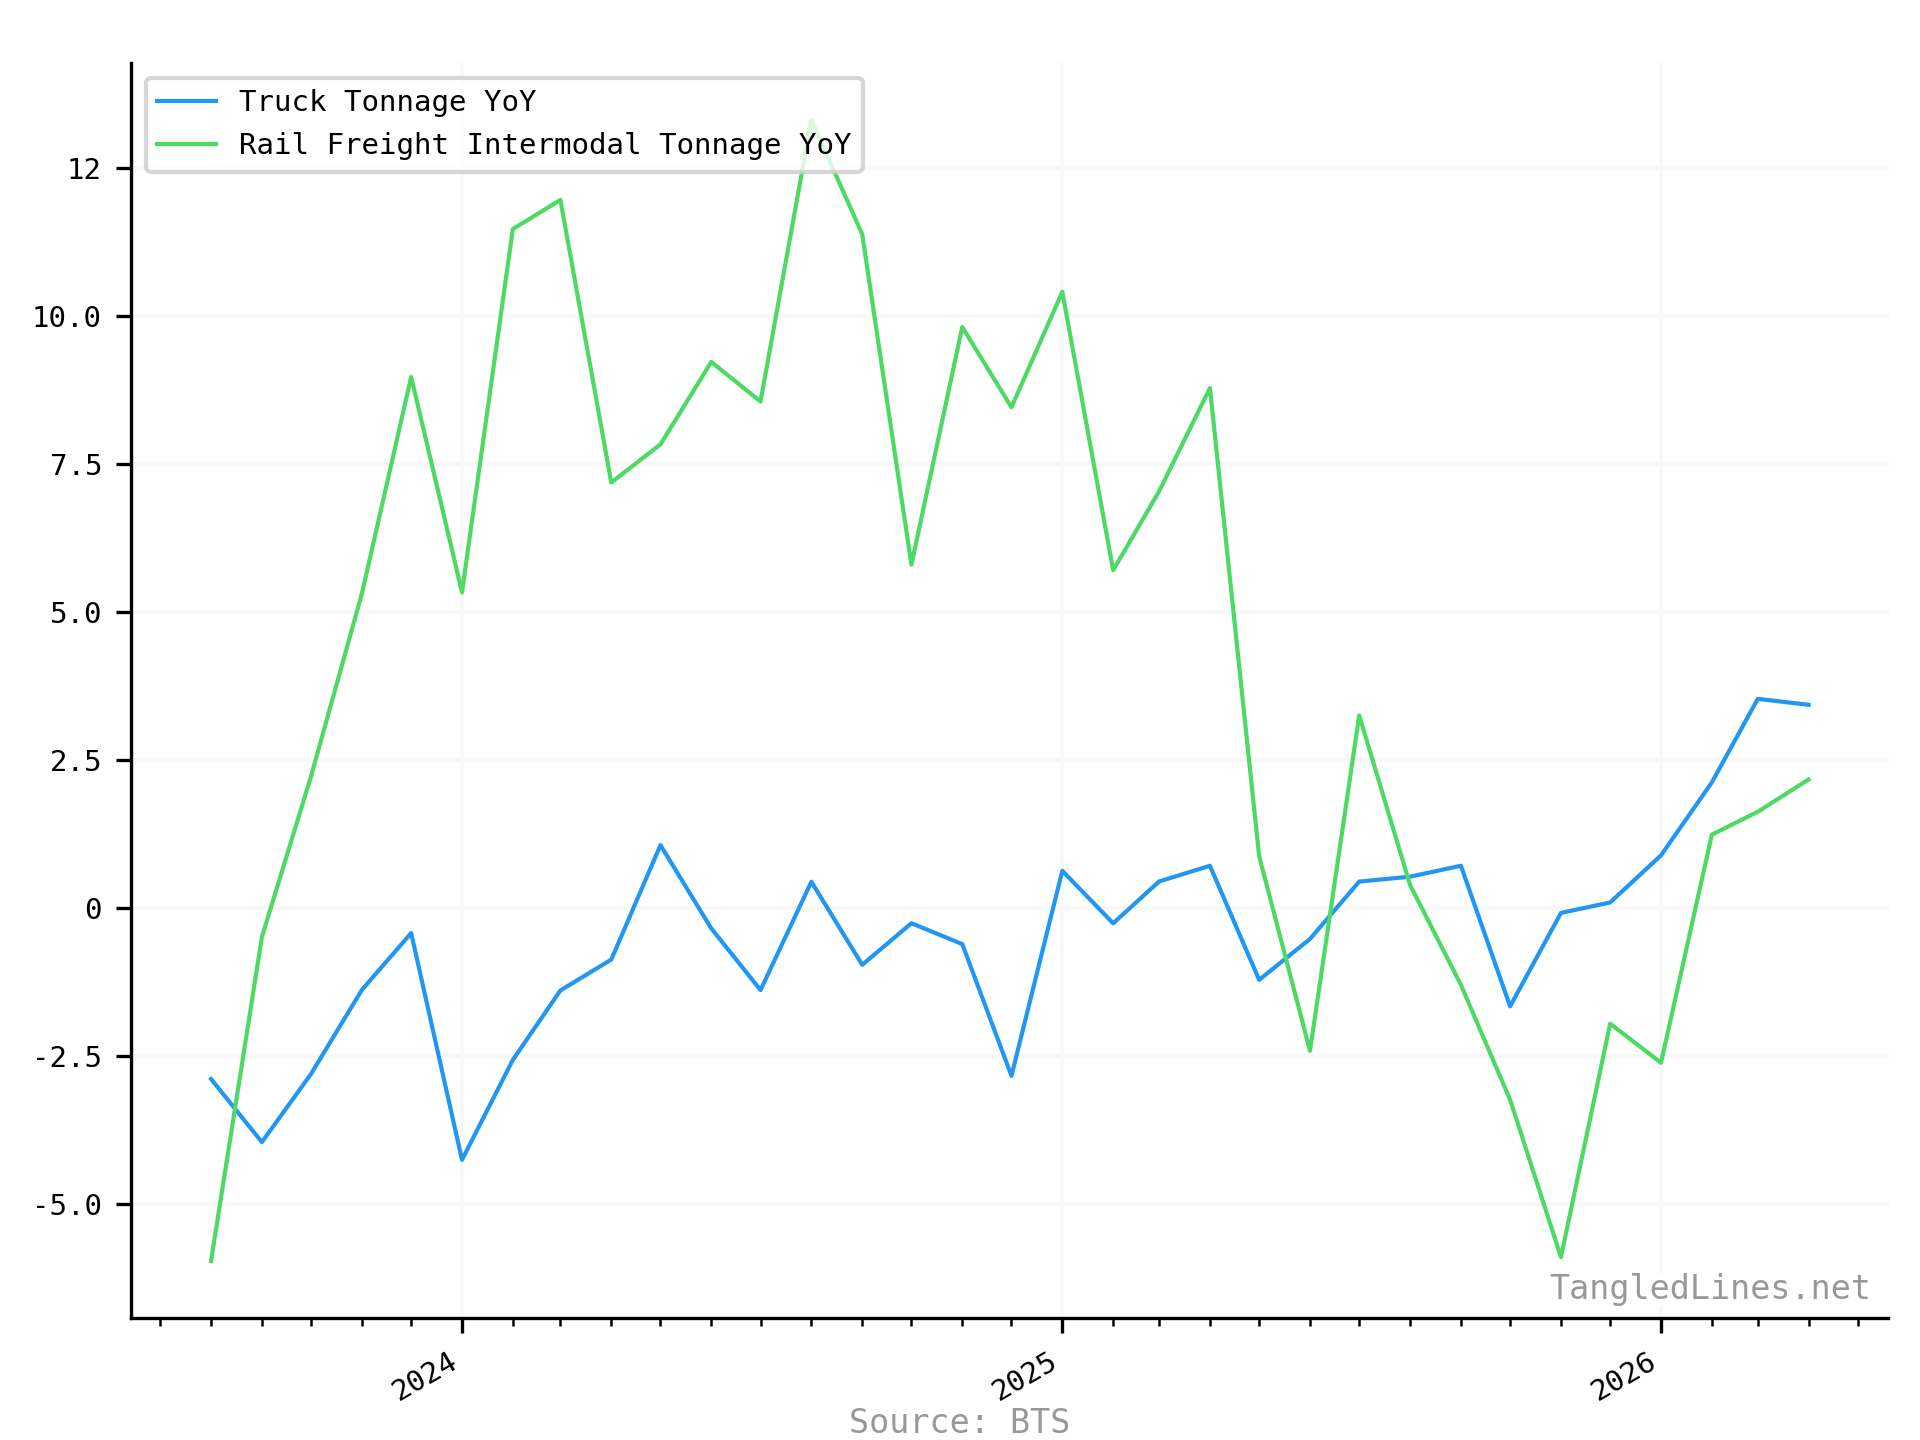
| Series | Latest | Date |
|---|---|---|
| Truck Tonnage YoY | 3.43 | 2026-04-01
Reported 2026-07-01 |
| Rail Freight Intermodal Tonnage YoY | 2.17 | 2026-04-01
Reported 2026-07-01 |
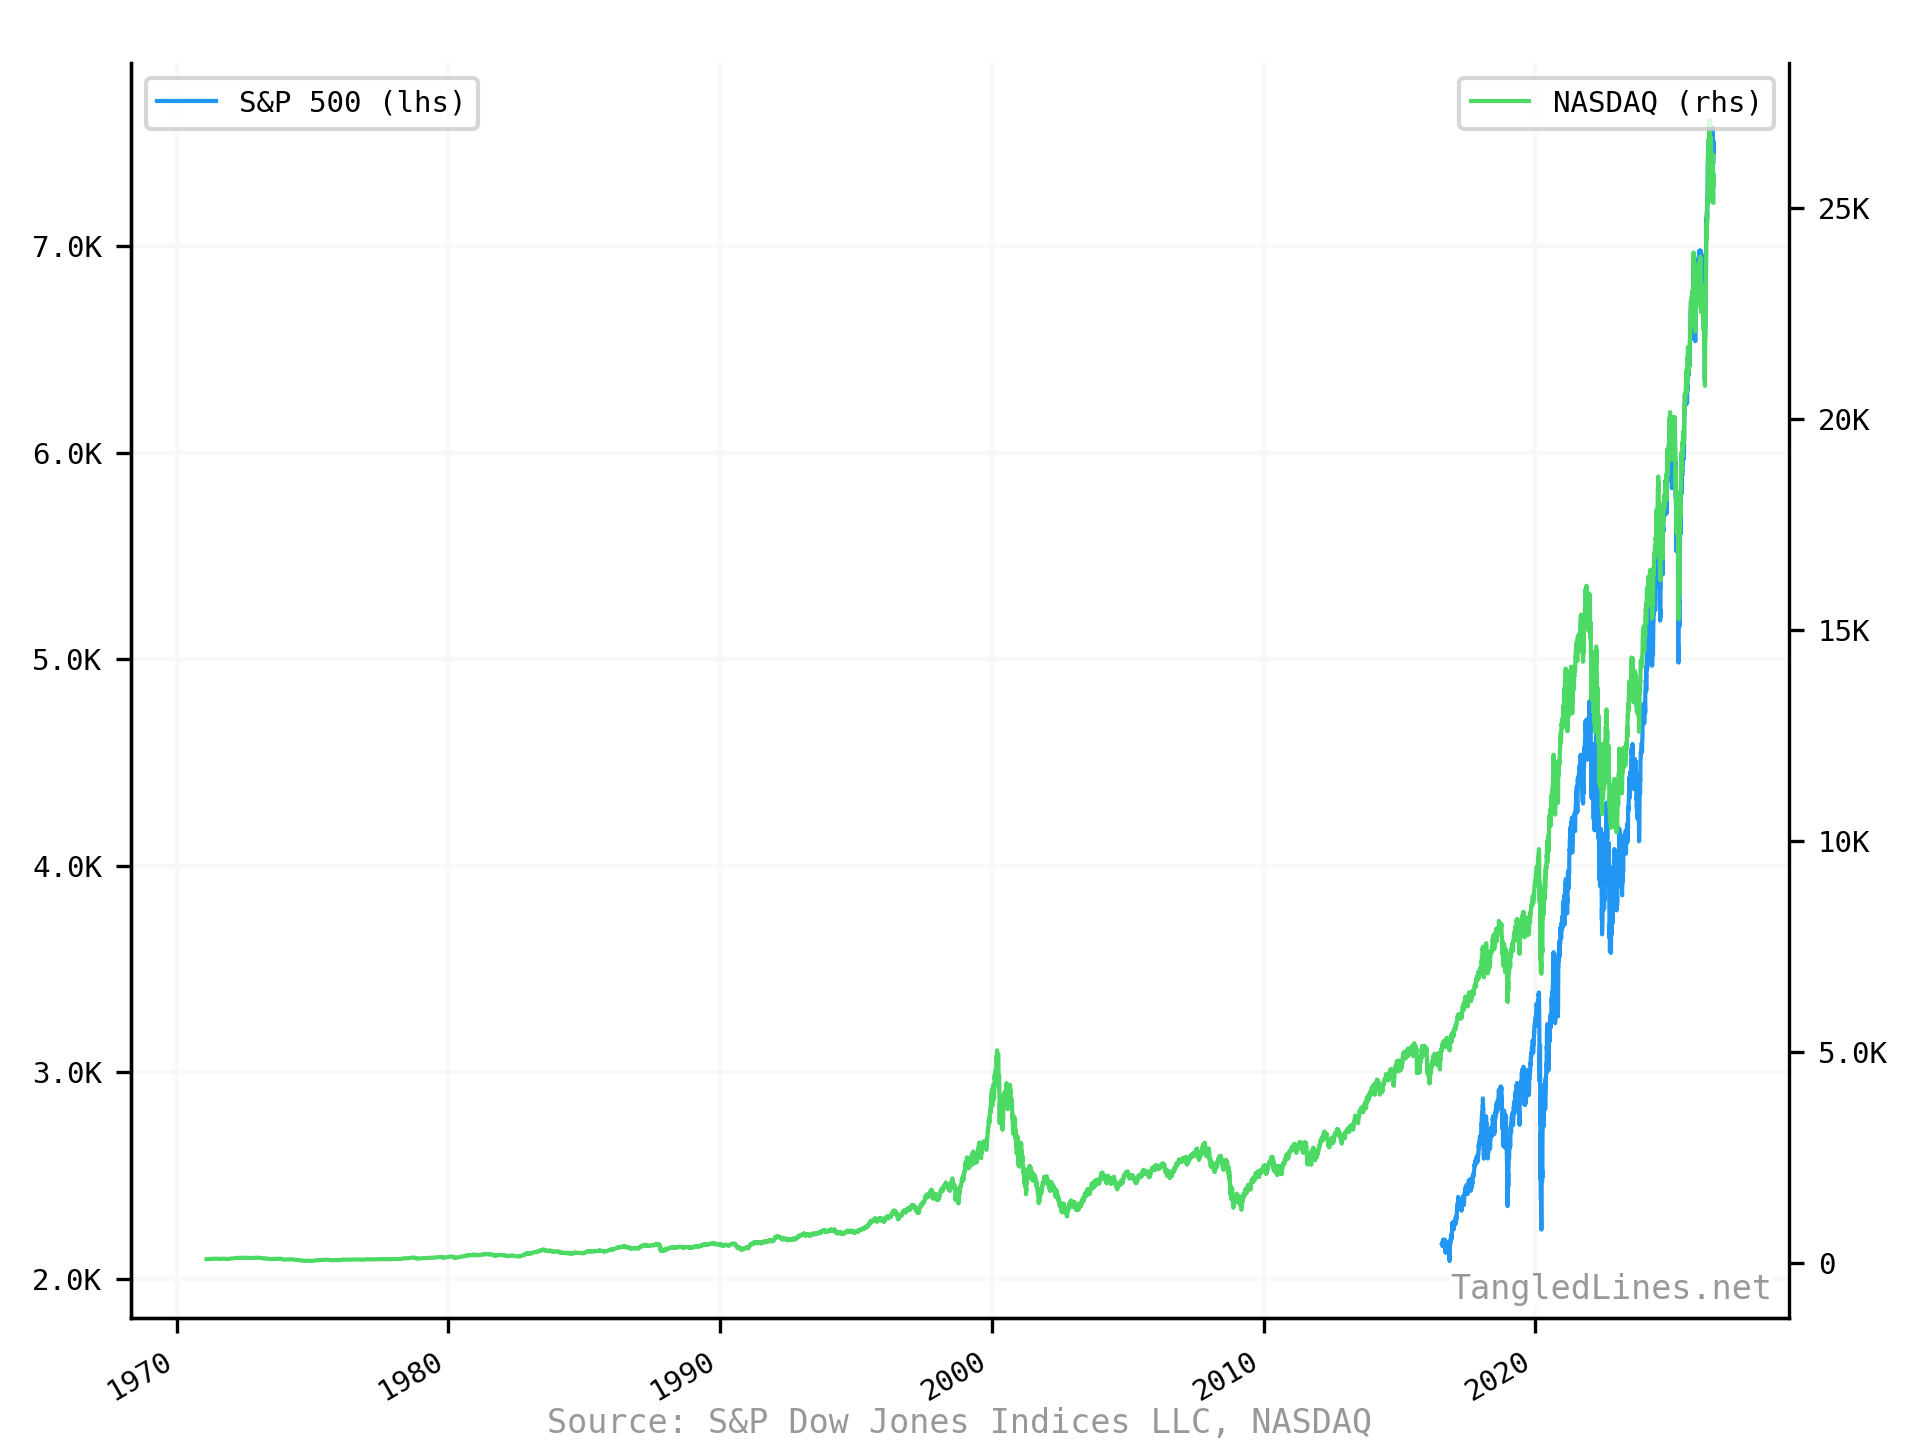
U.S. Stock Indices

About the Yield Report
Goal: Convey fixed income yields and drivers. These rates are a major input into equity valuations via the discount rate.
Coming Soon: Credit spreads and fiscal spending. If you see a chart or metric you think would be useful here, send it to Justin.
This report is generated daily and sent to subscribers either daily or weekly. Data comes from FRED and EOD.